Immigrants vs Venezuelan Child Poverty Among Girls Under 16
COMPARE
Immigrants
Venezuelan
Child Poverty Among Girls Under 16
Child Poverty Among Girls Under 16 Comparison
Immigrants
Venezuelans
17.7%
CHILD POVERTY AMONG GIRLS UNDER 16
7.3/ 100
METRIC RATING
210th/ 347
METRIC RANK
15.8%
CHILD POVERTY AMONG GIRLS UNDER 16
80.1/ 100
METRIC RATING
151st/ 347
METRIC RANK
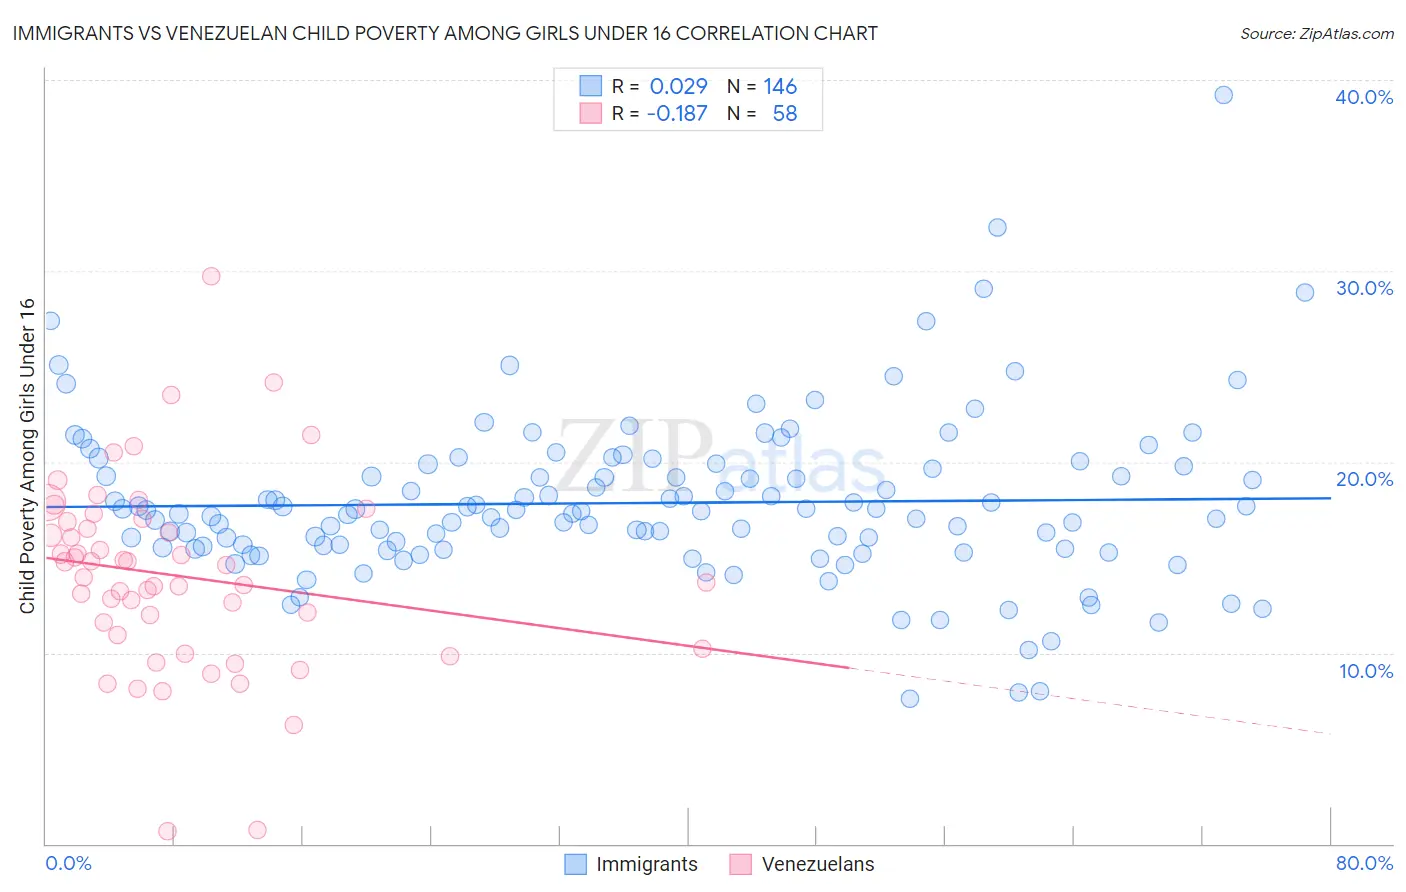
Immigrants vs Venezuelan Child Poverty Among Girls Under 16 Correlation Chart
The statistical analysis conducted on geographies consisting of 554,633,406 people shows no correlation between the proportion of Immigrants and poverty level among girls under the age of 16 in the United States with a correlation coefficient (R) of 0.029 and weighted average of 17.7%. Similarly, the statistical analysis conducted on geographies consisting of 302,424,022 people shows a poor negative correlation between the proportion of Venezuelans and poverty level among girls under the age of 16 in the United States with a correlation coefficient (R) of -0.187 and weighted average of 15.8%, a difference of 11.8%.
Child Poverty Among Girls Under 16 Correlation Summary
| Measurement | Immigrants | Venezuelan |
| Minimum | 7.6% | 0.62% |
| Maximum | 39.2% | 29.7% |
| Range | 31.6% | 29.1% |
| Mean | 17.8% | 14.0% |
| Median | 17.4% | 14.3% |
| Interquartile 25% (IQ1) | 15.5% | 10.9% |
| Interquartile 75% (IQ3) | 19.8% | 16.9% |
| Interquartile Range (IQR) | 4.3% | 5.9% |
| Standard Deviation (Sample) | 4.3% | 5.1% |
| Standard Deviation (Population) | 4.3% | 5.0% |
Similar Demographics by Child Poverty Among Girls Under 16
Demographics Similar to Immigrants by Child Poverty Among Girls Under 16
In terms of child poverty among girls under 16, the demographic groups most similar to Immigrants are Immigrants from Eastern Africa (17.7%, a difference of 0.39%), Immigrants from Thailand (17.7%, a difference of 0.44%), Panamanian (17.6%, a difference of 0.51%), Sierra Leonean (17.6%, a difference of 0.58%), and Pennsylvania German (17.8%, a difference of 0.70%).
| Demographics | Rating | Rank | Child Poverty Among Girls Under 16 |
| Ugandans | 17.5 /100 | #203 | Poor 17.2% |
| Iraqis | 13.0 /100 | #204 | Poor 17.4% |
| Immigrants | Cameroon | 12.6 /100 | #205 | Poor 17.4% |
| Delaware | 11.5 /100 | #206 | Poor 17.4% |
| Hmong | 10.6 /100 | #207 | Poor 17.5% |
| Sierra Leoneans | 8.9 /100 | #208 | Tragic 17.6% |
| Panamanians | 8.7 /100 | #209 | Tragic 17.6% |
| Immigrants | Immigrants | 7.3 /100 | #210 | Tragic 17.7% |
| Immigrants | Eastern Africa | 6.4 /100 | #211 | Tragic 17.7% |
| Immigrants | Thailand | 6.3 /100 | #212 | Tragic 17.7% |
| Pennsylvania Germans | 5.7 /100 | #213 | Tragic 17.8% |
| Malaysians | 5.7 /100 | #214 | Tragic 17.8% |
| German Russians | 5.7 /100 | #215 | Tragic 17.8% |
| Moroccans | 5.5 /100 | #216 | Tragic 17.8% |
| Japanese | 5.3 /100 | #217 | Tragic 17.8% |
Demographics Similar to Venezuelans by Child Poverty Among Girls Under 16
In terms of child poverty among girls under 16, the demographic groups most similar to Venezuelans are Immigrants from Albania (15.8%, a difference of 0.10%), Immigrants from Hungary (15.8%, a difference of 0.14%), Immigrants from Kuwait (15.8%, a difference of 0.14%), Immigrants from Nepal (15.9%, a difference of 0.29%), and Icelander (15.7%, a difference of 0.46%).
| Demographics | Rating | Rank | Child Poverty Among Girls Under 16 |
| Israelis | 86.3 /100 | #144 | Excellent 15.6% |
| Welsh | 85.4 /100 | #145 | Excellent 15.6% |
| Samoans | 84.2 /100 | #146 | Excellent 15.7% |
| Slavs | 83.1 /100 | #147 | Excellent 15.7% |
| Icelanders | 82.4 /100 | #148 | Excellent 15.7% |
| Immigrants | Hungary | 80.9 /100 | #149 | Excellent 15.8% |
| Immigrants | Albania | 80.7 /100 | #150 | Excellent 15.8% |
| Venezuelans | 80.1 /100 | #151 | Excellent 15.8% |
| Immigrants | Kuwait | 79.4 /100 | #152 | Good 15.8% |
| Immigrants | Nepal | 78.5 /100 | #153 | Good 15.9% |
| Immigrants | Chile | 76.7 /100 | #154 | Good 15.9% |
| Syrians | 76.7 /100 | #155 | Good 15.9% |
| Immigrants | Fiji | 76.1 /100 | #156 | Good 15.9% |
| Colombians | 76.1 /100 | #157 | Good 15.9% |
| Guamanians/Chamorros | 75.3 /100 | #158 | Good 15.9% |