Aleut vs Cree Hearing Disability
COMPARE
Aleut
Cree
Hearing Disability
Hearing Disability Comparison
Aleuts
Cree
4.3%
HEARING DISABILITY
0.0/ 100
METRIC RATING
334th/ 347
METRIC RANK
3.8%
HEARING DISABILITY
0.0/ 100
METRIC RATING
310th/ 347
METRIC RANK
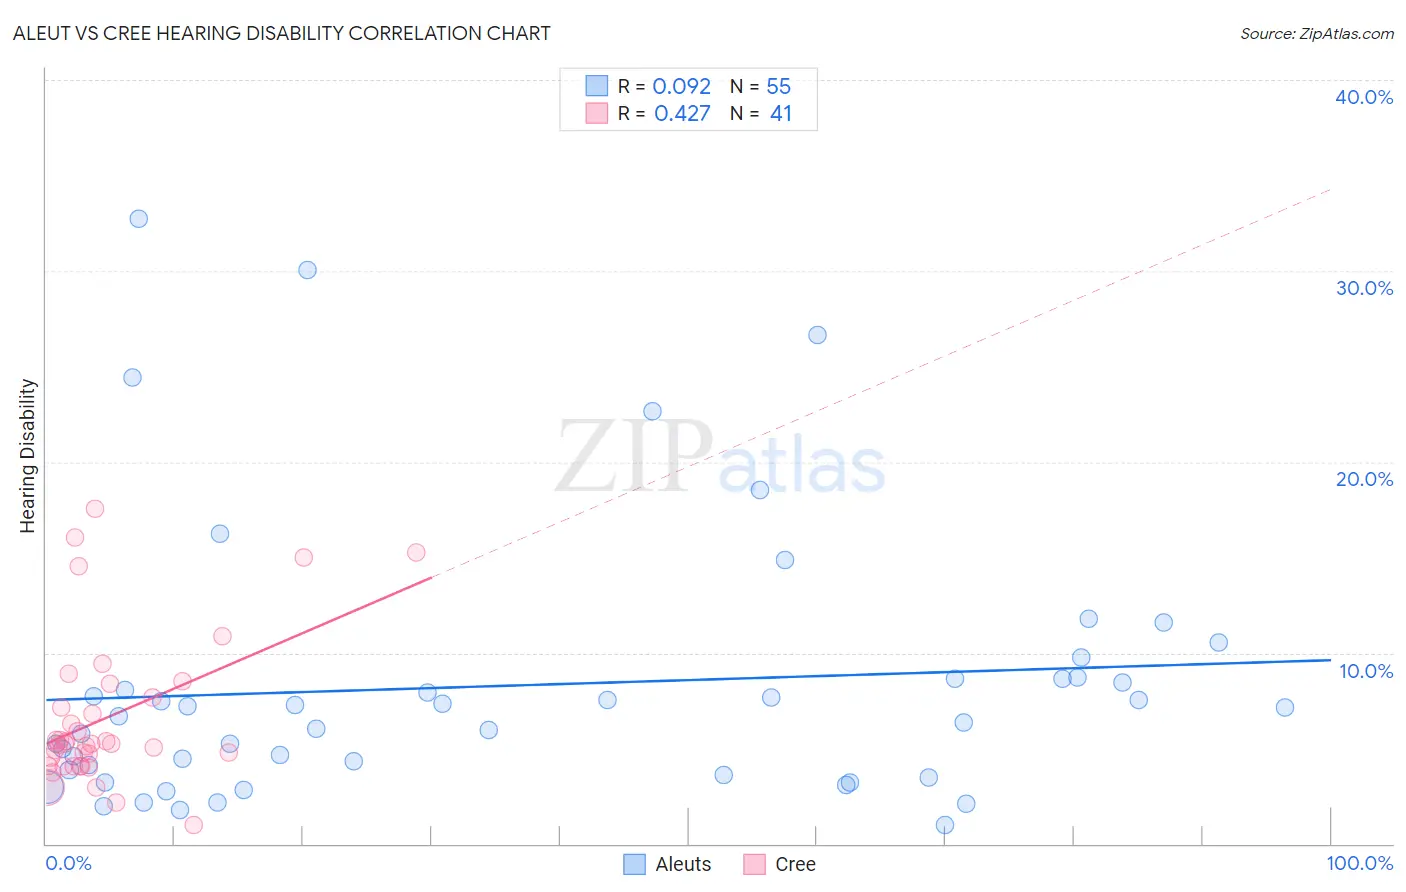
Aleut vs Cree Hearing Disability Correlation Chart
The statistical analysis conducted on geographies consisting of 61,781,709 people shows a slight positive correlation between the proportion of Aleuts and percentage of population with hearing disability in the United States with a correlation coefficient (R) of 0.092 and weighted average of 4.3%. Similarly, the statistical analysis conducted on geographies consisting of 76,207,567 people shows a moderate positive correlation between the proportion of Cree and percentage of population with hearing disability in the United States with a correlation coefficient (R) of 0.427 and weighted average of 3.8%, a difference of 11.4%.
Hearing Disability Correlation Summary
| Measurement | Aleut | Cree |
| Minimum | 0.97% | 0.96% |
| Maximum | 32.7% | 17.6% |
| Range | 31.7% | 16.6% |
| Mean | 8.3% | 6.6% |
| Median | 6.7% | 5.2% |
| Interquartile 25% (IQ1) | 3.6% | 4.1% |
| Interquartile 75% (IQ3) | 8.6% | 8.0% |
| Interquartile Range (IQR) | 5.0% | 4.0% |
| Standard Deviation (Sample) | 7.1% | 3.9% |
| Standard Deviation (Population) | 7.1% | 3.9% |
Similar Demographics by Hearing Disability
Demographics Similar to Aleuts by Hearing Disability
In terms of hearing disability, the demographic groups most similar to Aleuts are Dutch West Indian (4.3%, a difference of 0.54%), Houma (4.2%, a difference of 1.1%), Kiowa (4.3%, a difference of 1.3%), Cherokee (4.2%, a difference of 1.8%), and Native/Alaskan (4.2%, a difference of 2.0%).
| Demographics | Rating | Rank | Hearing Disability |
| Arapaho | 0.0 /100 | #327 | Tragic 4.1% |
| Tohono O'odham | 0.0 /100 | #328 | Tragic 4.2% |
| Crow | 0.0 /100 | #329 | Tragic 4.2% |
| Natives/Alaskans | 0.0 /100 | #330 | Tragic 4.2% |
| Cherokee | 0.0 /100 | #331 | Tragic 4.2% |
| Houma | 0.0 /100 | #332 | Tragic 4.2% |
| Dutch West Indians | 0.0 /100 | #333 | Tragic 4.3% |
| Aleuts | 0.0 /100 | #334 | Tragic 4.3% |
| Kiowa | 0.0 /100 | #335 | Tragic 4.3% |
| Creek | 0.0 /100 | #336 | Tragic 4.4% |
| Chickasaw | 0.0 /100 | #337 | Tragic 4.5% |
| Alaska Natives | 0.0 /100 | #338 | Tragic 4.5% |
| Choctaw | 0.0 /100 | #339 | Tragic 4.5% |
| Pueblo | 0.0 /100 | #340 | Tragic 4.6% |
| Navajo | 0.0 /100 | #341 | Tragic 4.6% |
Demographics Similar to Cree by Hearing Disability
In terms of hearing disability, the demographic groups most similar to Cree are Scotch-Irish (3.8%, a difference of 0.31%), Ottawa (3.8%, a difference of 0.39%), French Canadian (3.8%, a difference of 0.83%), Marshallese (3.8%, a difference of 0.95%), and American (3.9%, a difference of 1.3%).
| Demographics | Rating | Rank | Hearing Disability |
| Menominee | 0.0 /100 | #303 | Tragic 3.7% |
| French | 0.0 /100 | #304 | Tragic 3.8% |
| English | 0.0 /100 | #305 | Tragic 3.8% |
| Marshallese | 0.0 /100 | #306 | Tragic 3.8% |
| French Canadians | 0.0 /100 | #307 | Tragic 3.8% |
| Ottawa | 0.0 /100 | #308 | Tragic 3.8% |
| Scotch-Irish | 0.0 /100 | #309 | Tragic 3.8% |
| Cree | 0.0 /100 | #310 | Tragic 3.8% |
| Americans | 0.0 /100 | #311 | Tragic 3.9% |
| Cajuns | 0.0 /100 | #312 | Tragic 3.9% |
| Hopi | 0.0 /100 | #313 | Tragic 3.9% |
| Yakama | 0.0 /100 | #314 | Tragic 3.9% |
| Puget Sound Salish | 0.0 /100 | #315 | Tragic 3.9% |
| Spanish Americans | 0.0 /100 | #316 | Tragic 4.0% |
| Comanche | 0.0 /100 | #317 | Tragic 4.0% |