Immigrants from India vs Ute Family Poverty
COMPARE
Immigrants from India
Ute
Family Poverty
Family Poverty Comparison
Immigrants from India
Ute
6.2%
FAMILY POVERTY
100.0/ 100
METRIC RATING
1st/ 347
METRIC RANK
12.1%
FAMILY POVERTY
0.0/ 100
METRIC RATING
311th/ 347
METRIC RANK
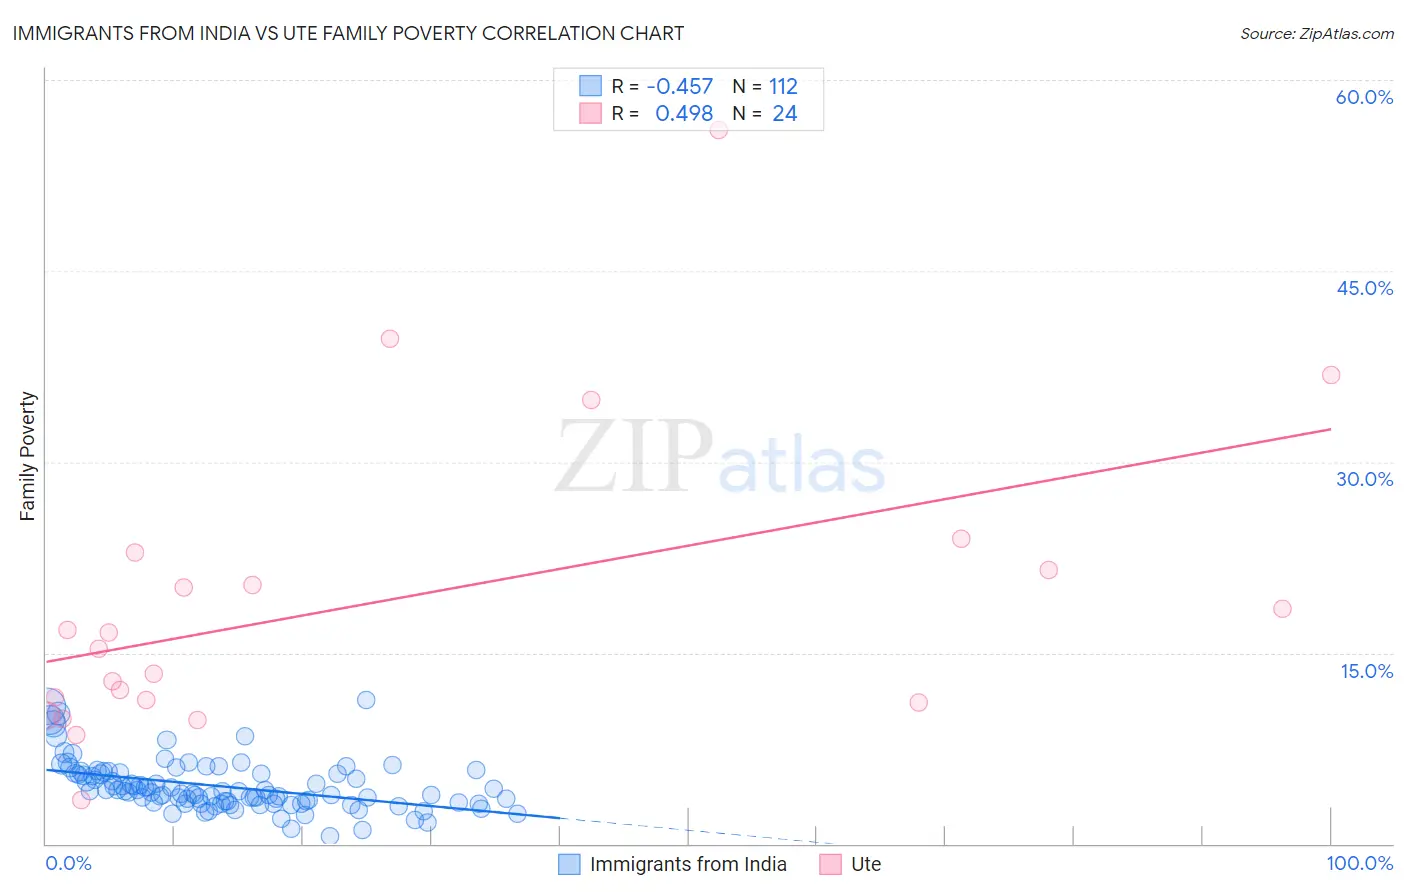
Immigrants from India vs Ute Family Poverty Correlation Chart
The statistical analysis conducted on geographies consisting of 432,464,451 people shows a moderate negative correlation between the proportion of Immigrants from India and poverty level among families in the United States with a correlation coefficient (R) of -0.457 and weighted average of 6.2%. Similarly, the statistical analysis conducted on geographies consisting of 55,645,170 people shows a moderate positive correlation between the proportion of Ute and poverty level among families in the United States with a correlation coefficient (R) of 0.498 and weighted average of 12.1%, a difference of 93.3%.
Family Poverty Correlation Summary
| Measurement | Immigrants from India | Ute |
| Minimum | 0.60% | 3.5% |
| Maximum | 11.3% | 56.1% |
| Range | 10.7% | 52.6% |
| Mean | 4.5% | 19.0% |
| Median | 4.1% | 15.9% |
| Interquartile 25% (IQ1) | 3.2% | 11.2% |
| Interquartile 75% (IQ3) | 5.5% | 22.2% |
| Interquartile Range (IQR) | 2.3% | 11.0% |
| Standard Deviation (Sample) | 1.9% | 12.1% |
| Standard Deviation (Population) | 1.9% | 11.8% |
Similar Demographics by Family Poverty
Demographics Similar to Immigrants from India by Family Poverty
In terms of family poverty, the demographic groups most similar to Immigrants from India are Chinese (6.5%, a difference of 4.3%), Immigrants from Taiwan (6.6%, a difference of 6.0%), Filipino (6.6%, a difference of 6.6%), Thai (6.7%, a difference of 7.2%), and Norwegian (6.9%, a difference of 10.5%).
| Demographics | Rating | Rank | Family Poverty |
| Immigrants | India | 100.0 /100 | #1 | Exceptional 6.2% |
| Chinese | 100.0 /100 | #2 | Exceptional 6.5% |
| Immigrants | Taiwan | 100.0 /100 | #3 | Exceptional 6.6% |
| Filipinos | 100.0 /100 | #4 | Exceptional 6.6% |
| Thais | 100.0 /100 | #5 | Exceptional 6.7% |
| Norwegians | 99.9 /100 | #6 | Exceptional 6.9% |
| Immigrants | Ireland | 99.9 /100 | #7 | Exceptional 7.0% |
| Bhutanese | 99.9 /100 | #8 | Exceptional 7.0% |
| Latvians | 99.9 /100 | #9 | Exceptional 7.1% |
| Bulgarians | 99.8 /100 | #10 | Exceptional 7.1% |
| Immigrants | Singapore | 99.8 /100 | #11 | Exceptional 7.1% |
| Maltese | 99.8 /100 | #12 | Exceptional 7.1% |
| Swedes | 99.8 /100 | #13 | Exceptional 7.1% |
| Iranians | 99.8 /100 | #14 | Exceptional 7.1% |
| Lithuanians | 99.8 /100 | #15 | Exceptional 7.2% |
Demographics Similar to Ute by Family Poverty
In terms of family poverty, the demographic groups most similar to Ute are Immigrants from Central America (12.1%, a difference of 0.38%), Hispanic or Latino (12.0%, a difference of 0.84%), Immigrants from Guatemala (12.0%, a difference of 0.84%), Immigrants from Caribbean (12.2%, a difference of 1.1%), and Seminole (11.9%, a difference of 1.3%).
| Demographics | Rating | Rank | Family Poverty |
| Immigrants | Latin America | 0.0 /100 | #304 | Tragic 11.8% |
| Mexicans | 0.0 /100 | #305 | Tragic 11.8% |
| Cajuns | 0.0 /100 | #306 | Tragic 11.9% |
| Immigrants | Congo | 0.0 /100 | #307 | Tragic 11.9% |
| Seminole | 0.0 /100 | #308 | Tragic 11.9% |
| Hispanics or Latinos | 0.0 /100 | #309 | Tragic 12.0% |
| Immigrants | Guatemala | 0.0 /100 | #310 | Tragic 12.0% |
| Ute | 0.0 /100 | #311 | Tragic 12.1% |
| Immigrants | Central America | 0.0 /100 | #312 | Tragic 12.1% |
| Immigrants | Caribbean | 0.0 /100 | #313 | Tragic 12.2% |
| Kiowa | 0.0 /100 | #314 | Tragic 12.2% |
| Immigrants | Mexico | 0.0 /100 | #315 | Tragic 12.3% |
| Hondurans | 0.0 /100 | #316 | Tragic 12.4% |
| Immigrants | Grenada | 0.0 /100 | #317 | Tragic 12.4% |
| U.S. Virgin Islanders | 0.0 /100 | #318 | Tragic 12.4% |