Alaskan Athabascan vs Ute Family Poverty
COMPARE
Alaskan Athabascan
Ute
Family Poverty
Family Poverty Comparison
Alaskan Athabascans
Ute
10.1%
FAMILY POVERTY
2.7/ 100
METRIC RATING
231st/ 347
METRIC RANK
12.1%
FAMILY POVERTY
0.0/ 100
METRIC RATING
311th/ 347
METRIC RANK
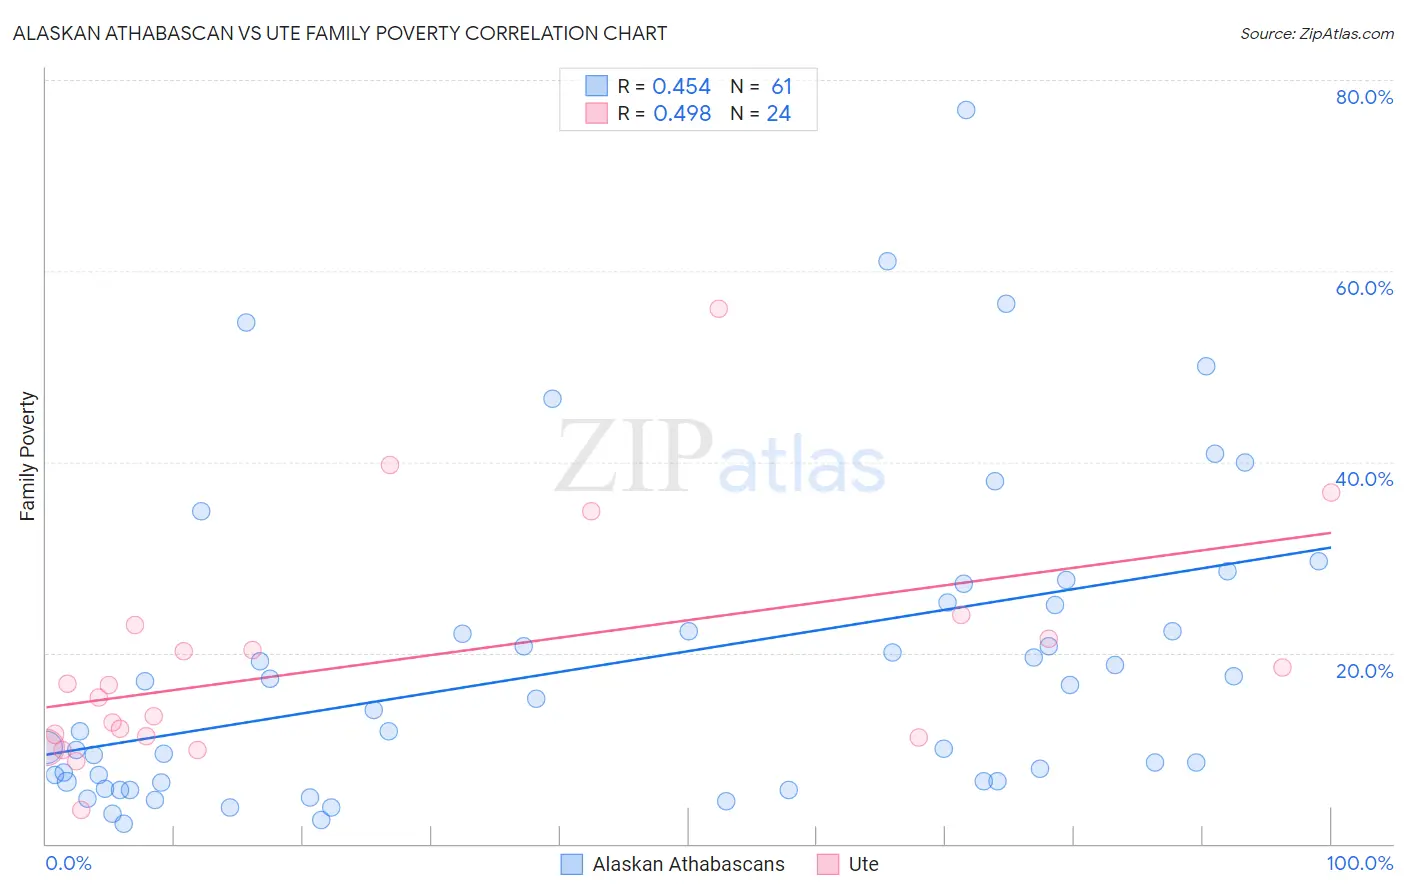
Alaskan Athabascan vs Ute Family Poverty Correlation Chart
The statistical analysis conducted on geographies consisting of 45,790,128 people shows a moderate positive correlation between the proportion of Alaskan Athabascans and poverty level among families in the United States with a correlation coefficient (R) of 0.454 and weighted average of 10.1%. Similarly, the statistical analysis conducted on geographies consisting of 55,645,170 people shows a moderate positive correlation between the proportion of Ute and poverty level among families in the United States with a correlation coefficient (R) of 0.498 and weighted average of 12.1%, a difference of 19.8%.
Family Poverty Correlation Summary
| Measurement | Alaskan Athabascan | Ute |
| Minimum | 2.0% | 3.5% |
| Maximum | 76.9% | 56.1% |
| Range | 74.9% | 52.6% |
| Mean | 18.8% | 19.0% |
| Median | 14.0% | 15.9% |
| Interquartile 25% (IQ1) | 6.5% | 11.2% |
| Interquartile 75% (IQ3) | 25.1% | 22.2% |
| Interquartile Range (IQR) | 18.6% | 11.0% |
| Standard Deviation (Sample) | 16.5% | 12.1% |
| Standard Deviation (Population) | 16.3% | 11.8% |
Similar Demographics by Family Poverty
Demographics Similar to Alaskan Athabascans by Family Poverty
In terms of family poverty, the demographic groups most similar to Alaskan Athabascans are Immigrants from Panama (10.0%, a difference of 0.38%), Immigrants from Uzbekistan (10.0%, a difference of 0.40%), Sudanese (10.0%, a difference of 0.41%), Immigrants from Sudan (10.1%, a difference of 0.43%), and Immigrants from Armenia (10.0%, a difference of 0.62%).
| Demographics | Rating | Rank | Family Poverty |
| Marshallese | 3.9 /100 | #224 | Tragic 9.9% |
| Immigrants | Immigrants | 3.6 /100 | #225 | Tragic 10.0% |
| Ottawa | 3.3 /100 | #226 | Tragic 10.0% |
| Immigrants | Armenia | 3.3 /100 | #227 | Tragic 10.0% |
| Sudanese | 3.1 /100 | #228 | Tragic 10.0% |
| Immigrants | Uzbekistan | 3.1 /100 | #229 | Tragic 10.0% |
| Immigrants | Panama | 3.1 /100 | #230 | Tragic 10.0% |
| Alaskan Athabascans | 2.7 /100 | #231 | Tragic 10.1% |
| Immigrants | Sudan | 2.3 /100 | #232 | Tragic 10.1% |
| Fijians | 2.1 /100 | #233 | Tragic 10.1% |
| Immigrants | Middle Africa | 2.1 /100 | #234 | Tragic 10.1% |
| Nigerians | 2.0 /100 | #235 | Tragic 10.1% |
| Immigrants | Nigeria | 1.9 /100 | #236 | Tragic 10.2% |
| Immigrants | Laos | 1.7 /100 | #237 | Tragic 10.2% |
| French American Indians | 1.5 /100 | #238 | Tragic 10.2% |
Demographics Similar to Ute by Family Poverty
In terms of family poverty, the demographic groups most similar to Ute are Immigrants from Central America (12.1%, a difference of 0.38%), Hispanic or Latino (12.0%, a difference of 0.84%), Immigrants from Guatemala (12.0%, a difference of 0.84%), Immigrants from Caribbean (12.2%, a difference of 1.1%), and Seminole (11.9%, a difference of 1.3%).
| Demographics | Rating | Rank | Family Poverty |
| Immigrants | Latin America | 0.0 /100 | #304 | Tragic 11.8% |
| Mexicans | 0.0 /100 | #305 | Tragic 11.8% |
| Cajuns | 0.0 /100 | #306 | Tragic 11.9% |
| Immigrants | Congo | 0.0 /100 | #307 | Tragic 11.9% |
| Seminole | 0.0 /100 | #308 | Tragic 11.9% |
| Hispanics or Latinos | 0.0 /100 | #309 | Tragic 12.0% |
| Immigrants | Guatemala | 0.0 /100 | #310 | Tragic 12.0% |
| Ute | 0.0 /100 | #311 | Tragic 12.1% |
| Immigrants | Central America | 0.0 /100 | #312 | Tragic 12.1% |
| Immigrants | Caribbean | 0.0 /100 | #313 | Tragic 12.2% |
| Kiowa | 0.0 /100 | #314 | Tragic 12.2% |
| Immigrants | Mexico | 0.0 /100 | #315 | Tragic 12.3% |
| Hondurans | 0.0 /100 | #316 | Tragic 12.4% |
| Immigrants | Grenada | 0.0 /100 | #317 | Tragic 12.4% |
| U.S. Virgin Islanders | 0.0 /100 | #318 | Tragic 12.4% |