Albanian vs Scottish Child Poverty Among Boys Under 16
COMPARE
Albanian
Scottish
Child Poverty Among Boys Under 16
Child Poverty Among Boys Under 16 Comparison
Albanians
Scottish
15.6%
CHILD POVERTY AMONG BOYS UNDER 16
86.5/ 100
METRIC RATING
139th/ 347
METRIC RANK
15.2%
CHILD POVERTY AMONG BOYS UNDER 16
93.0/ 100
METRIC RATING
121st/ 347
METRIC RANK
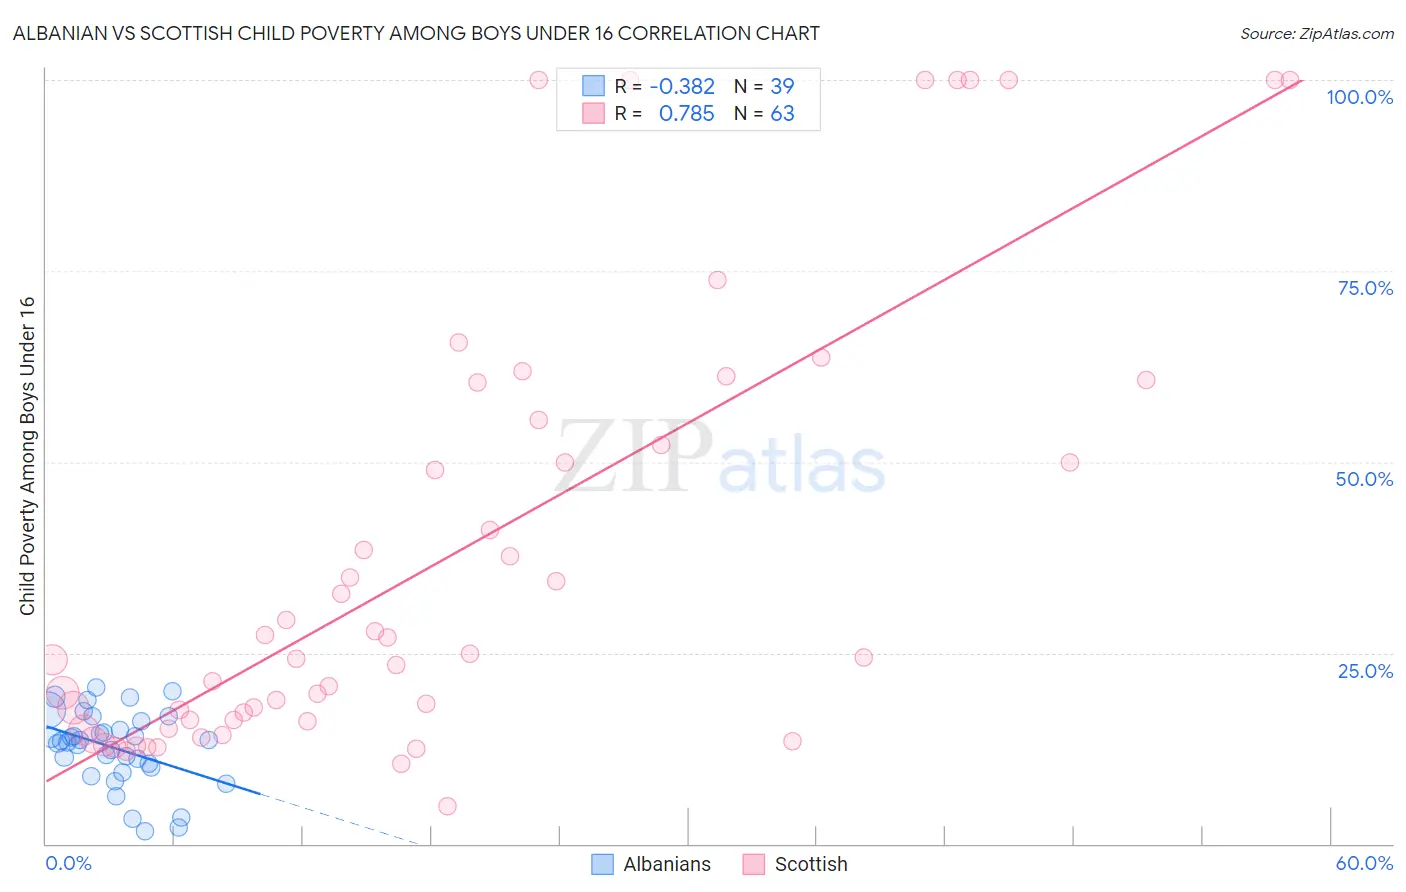
Albanian vs Scottish Child Poverty Among Boys Under 16 Correlation Chart
The statistical analysis conducted on geographies consisting of 190,811,063 people shows a mild negative correlation between the proportion of Albanians and poverty level among boys under the age of 16 in the United States with a correlation coefficient (R) of -0.382 and weighted average of 15.6%. Similarly, the statistical analysis conducted on geographies consisting of 546,371,305 people shows a strong positive correlation between the proportion of Scottish and poverty level among boys under the age of 16 in the United States with a correlation coefficient (R) of 0.785 and weighted average of 15.2%, a difference of 2.2%.
Child Poverty Among Boys Under 16 Correlation Summary
| Measurement | Albanian | Scottish |
| Minimum | 1.7% | 5.0% |
| Maximum | 20.4% | 100.0% |
| Range | 18.7% | 95.0% |
| Mean | 12.6% | 37.8% |
| Median | 13.5% | 24.3% |
| Interquartile 25% (IQ1) | 9.9% | 16.0% |
| Interquartile 75% (IQ3) | 16.0% | 55.6% |
| Interquartile Range (IQR) | 6.1% | 39.5% |
| Standard Deviation (Sample) | 4.8% | 29.2% |
| Standard Deviation (Population) | 4.8% | 29.0% |
Demographics Similar to Albanians and Scottish by Child Poverty Among Boys Under 16
In terms of child poverty among boys under 16, the demographic groups most similar to Albanians are Immigrants from Southern Europe (15.6%, a difference of 0.010%), Immigrants from Spain (15.6%, a difference of 0.15%), Immigrants from Kuwait (15.6%, a difference of 0.22%), Icelander (15.5%, a difference of 0.25%), and Portuguese (15.5%, a difference of 0.27%). Similarly, the demographic groups most similar to Scottish are South African (15.2%, a difference of 0.010%), Immigrants from Malaysia (15.3%, a difference of 0.10%), Immigrants from Norway (15.3%, a difference of 0.32%), Tlingit-Haida (15.3%, a difference of 0.33%), and Czechoslovakian (15.3%, a difference of 0.41%).
| Demographics | Rating | Rank | Child Poverty Among Boys Under 16 |
| South Africans | 93.0 /100 | #120 | Exceptional 15.2% |
| Scottish | 93.0 /100 | #121 | Exceptional 15.2% |
| Immigrants | Malaysia | 92.8 /100 | #122 | Exceptional 15.3% |
| Immigrants | Norway | 92.3 /100 | #123 | Exceptional 15.3% |
| Tlingit-Haida | 92.2 /100 | #124 | Exceptional 15.3% |
| Czechoslovakians | 92.1 /100 | #125 | Exceptional 15.3% |
| Palestinians | 91.3 /100 | #126 | Exceptional 15.4% |
| Carpatho Rusyns | 91.1 /100 | #127 | Exceptional 15.4% |
| Canadians | 90.6 /100 | #128 | Exceptional 15.4% |
| Immigrants | Brazil | 90.3 /100 | #129 | Exceptional 15.4% |
| Mongolians | 90.2 /100 | #130 | Exceptional 15.4% |
| Immigrants | Western Europe | 90.0 /100 | #131 | Exceptional 15.4% |
| Immigrants | Kazakhstan | 88.7 /100 | #132 | Excellent 15.5% |
| Welsh | 88.3 /100 | #133 | Excellent 15.5% |
| Peruvians | 88.1 /100 | #134 | Excellent 15.5% |
| Portuguese | 87.5 /100 | #135 | Excellent 15.5% |
| Icelanders | 87.5 /100 | #136 | Excellent 15.5% |
| Immigrants | Spain | 87.1 /100 | #137 | Excellent 15.6% |
| Immigrants | Southern Europe | 86.5 /100 | #138 | Excellent 15.6% |
| Albanians | 86.5 /100 | #139 | Excellent 15.6% |
| Immigrants | Kuwait | 85.6 /100 | #140 | Excellent 15.6% |