Albanian vs Immigrants from Chile Child Poverty Among Boys Under 16
COMPARE
Albanian
Immigrants from Chile
Child Poverty Among Boys Under 16
Child Poverty Among Boys Under 16 Comparison
Albanians
Immigrants from Chile
15.6%
CHILD POVERTY AMONG BOYS UNDER 16
86.5/ 100
METRIC RATING
139th/ 347
METRIC RANK
15.9%
CHILD POVERTY AMONG BOYS UNDER 16
74.8/ 100
METRIC RATING
159th/ 347
METRIC RANK
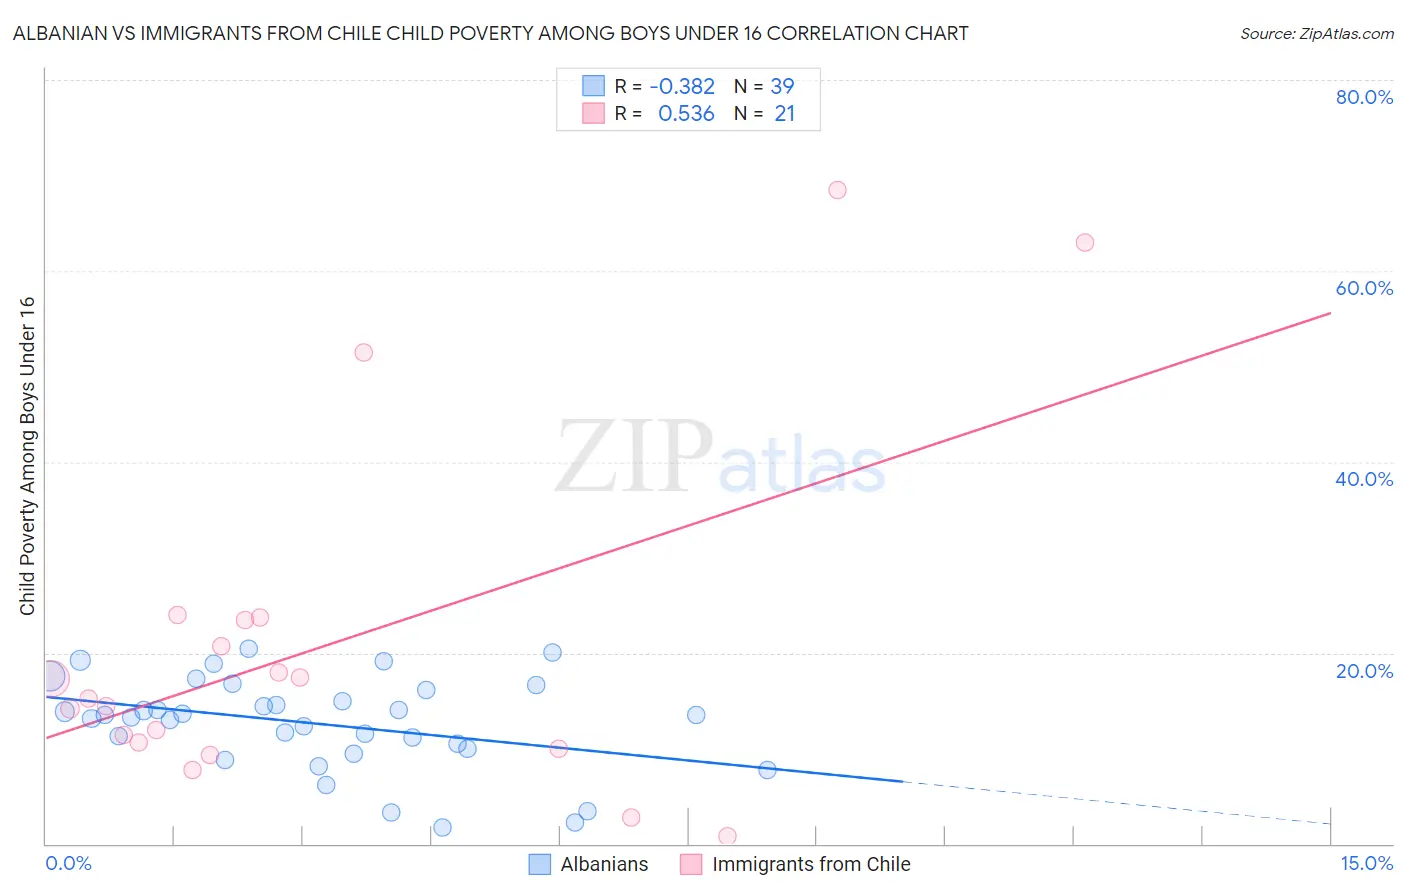
Albanian vs Immigrants from Chile Child Poverty Among Boys Under 16 Correlation Chart
The statistical analysis conducted on geographies consisting of 190,811,063 people shows a mild negative correlation between the proportion of Albanians and poverty level among boys under the age of 16 in the United States with a correlation coefficient (R) of -0.382 and weighted average of 15.6%. Similarly, the statistical analysis conducted on geographies consisting of 216,959,929 people shows a substantial positive correlation between the proportion of Immigrants from Chile and poverty level among boys under the age of 16 in the United States with a correlation coefficient (R) of 0.536 and weighted average of 15.9%, a difference of 2.3%.
Child Poverty Among Boys Under 16 Correlation Summary
| Measurement | Albanian | Immigrants from Chile |
| Minimum | 1.7% | 0.79% |
| Maximum | 20.4% | 68.4% |
| Range | 18.7% | 67.6% |
| Mean | 12.6% | 20.7% |
| Median | 13.5% | 15.2% |
| Interquartile 25% (IQ1) | 9.9% | 10.3% |
| Interquartile 75% (IQ3) | 16.0% | 23.5% |
| Interquartile Range (IQR) | 6.1% | 13.3% |
| Standard Deviation (Sample) | 4.8% | 18.1% |
| Standard Deviation (Population) | 4.8% | 17.7% |
Demographics Similar to Albanians and Immigrants from Chile by Child Poverty Among Boys Under 16
In terms of child poverty among boys under 16, the demographic groups most similar to Albanians are Immigrants from Kuwait (15.6%, a difference of 0.22%), Slavic (15.7%, a difference of 0.48%), Immigrants from Hungary (15.7%, a difference of 0.57%), Immigrants from Fiji (15.7%, a difference of 0.68%), and Immigrants from Peru (15.7%, a difference of 0.70%). Similarly, the demographic groups most similar to Immigrants from Chile are Yugoslavian (15.9%, a difference of 0.17%), Immigrants from Nepal (15.9%, a difference of 0.18%), Israeli (15.9%, a difference of 0.27%), French Canadian (15.9%, a difference of 0.28%), and Syrian (15.9%, a difference of 0.43%).
| Demographics | Rating | Rank | Child Poverty Among Boys Under 16 |
| Albanians | 86.5 /100 | #139 | Excellent 15.6% |
| Immigrants | Kuwait | 85.6 /100 | #140 | Excellent 15.6% |
| Slavs | 84.5 /100 | #141 | Excellent 15.7% |
| Immigrants | Hungary | 84.1 /100 | #142 | Excellent 15.7% |
| Immigrants | Fiji | 83.6 /100 | #143 | Excellent 15.7% |
| Immigrants | Peru | 83.5 /100 | #144 | Excellent 15.7% |
| Samoans | 83.2 /100 | #145 | Excellent 15.7% |
| New Zealanders | 82.4 /100 | #146 | Excellent 15.7% |
| Venezuelans | 82.1 /100 | #147 | Excellent 15.7% |
| Brazilians | 81.0 /100 | #148 | Excellent 15.8% |
| Slovaks | 80.3 /100 | #149 | Excellent 15.8% |
| Immigrants | Jordan | 80.2 /100 | #150 | Excellent 15.8% |
| Puget Sound Salish | 79.8 /100 | #151 | Good 15.8% |
| Immigrants | Venezuela | 79.5 /100 | #152 | Good 15.8% |
| French | 78.7 /100 | #153 | Good 15.8% |
| Syrians | 77.5 /100 | #154 | Good 15.9% |
| French Canadians | 76.6 /100 | #155 | Good 15.9% |
| Israelis | 76.5 /100 | #156 | Good 15.9% |
| Immigrants | Nepal | 76.0 /100 | #157 | Good 15.9% |
| Yugoslavians | 75.9 /100 | #158 | Good 15.9% |
| Immigrants | Chile | 74.8 /100 | #159 | Good 15.9% |