Jordanian vs Scottish Child Poverty Among Boys Under 16
COMPARE
Jordanian
Scottish
Child Poverty Among Boys Under 16
Child Poverty Among Boys Under 16 Comparison
Jordanians
Scottish
15.1%
CHILD POVERTY AMONG BOYS UNDER 16
95.1/ 100
METRIC RATING
107th/ 347
METRIC RANK
15.2%
CHILD POVERTY AMONG BOYS UNDER 16
93.0/ 100
METRIC RATING
121st/ 347
METRIC RANK
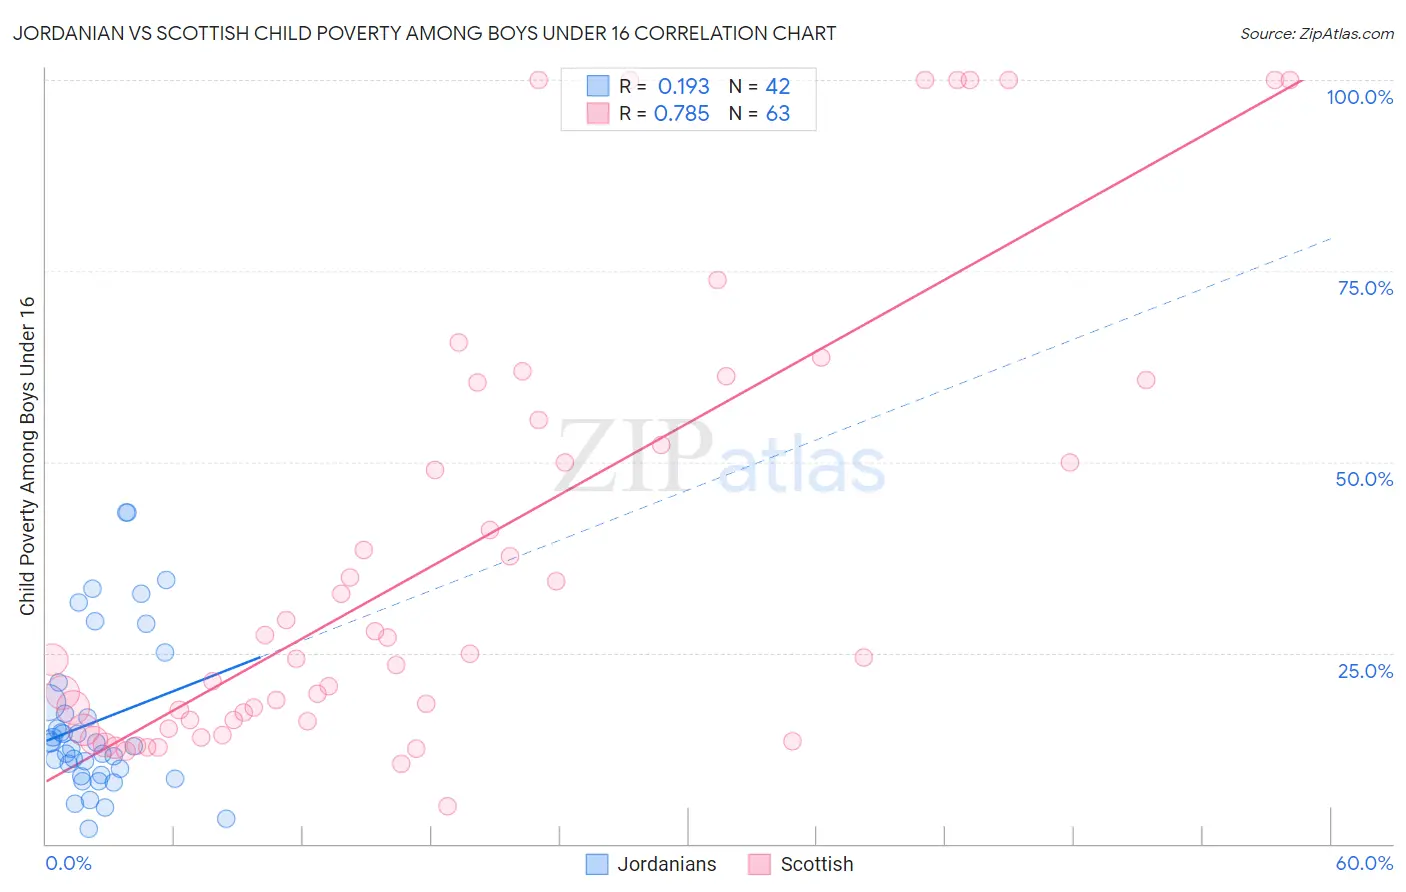
Jordanian vs Scottish Child Poverty Among Boys Under 16 Correlation Chart
The statistical analysis conducted on geographies consisting of 165,479,889 people shows a poor positive correlation between the proportion of Jordanians and poverty level among boys under the age of 16 in the United States with a correlation coefficient (R) of 0.193 and weighted average of 15.1%. Similarly, the statistical analysis conducted on geographies consisting of 546,371,305 people shows a strong positive correlation between the proportion of Scottish and poverty level among boys under the age of 16 in the United States with a correlation coefficient (R) of 0.785 and weighted average of 15.2%, a difference of 1.1%.
Child Poverty Among Boys Under 16 Correlation Summary
| Measurement | Jordanian | Scottish |
| Minimum | 1.9% | 5.0% |
| Maximum | 43.3% | 100.0% |
| Range | 41.4% | 95.0% |
| Mean | 16.0% | 37.8% |
| Median | 13.0% | 24.3% |
| Interquartile 25% (IQ1) | 9.0% | 16.0% |
| Interquartile 75% (IQ3) | 18.5% | 55.6% |
| Interquartile Range (IQR) | 9.5% | 39.5% |
| Standard Deviation (Sample) | 10.4% | 29.2% |
| Standard Deviation (Population) | 10.3% | 29.0% |
Demographics Similar to Jordanians and Scottish by Child Poverty Among Boys Under 16
In terms of child poverty among boys under 16, the demographic groups most similar to Jordanians are Serbian (15.1%, a difference of 0.11%), Immigrants from England (15.1%, a difference of 0.17%), Pakistani (15.1%, a difference of 0.21%), Dutch (15.0%, a difference of 0.22%), and Immigrants from Switzerland (15.0%, a difference of 0.24%). Similarly, the demographic groups most similar to Scottish are South African (15.2%, a difference of 0.010%), Belgian (15.2%, a difference of 0.060%), Immigrants from Malaysia (15.3%, a difference of 0.10%), Native Hawaiian (15.2%, a difference of 0.18%), and Immigrants from Vietnam (15.2%, a difference of 0.24%).
| Demographics | Rating | Rank | Child Poverty Among Boys Under 16 |
| Immigrants | Switzerland | 95.4 /100 | #104 | Exceptional 15.0% |
| Dutch | 95.4 /100 | #105 | Exceptional 15.0% |
| Serbians | 95.2 /100 | #106 | Exceptional 15.1% |
| Jordanians | 95.1 /100 | #107 | Exceptional 15.1% |
| Immigrants | England | 94.8 /100 | #108 | Exceptional 15.1% |
| Pakistanis | 94.7 /100 | #109 | Exceptional 15.1% |
| English | 94.3 /100 | #110 | Exceptional 15.1% |
| Immigrants | Zimbabwe | 94.2 /100 | #111 | Exceptional 15.2% |
| Basques | 93.8 /100 | #112 | Exceptional 15.2% |
| Irish | 93.8 /100 | #113 | Exceptional 15.2% |
| Immigrants | Ukraine | 93.6 /100 | #114 | Exceptional 15.2% |
| Armenians | 93.6 /100 | #115 | Exceptional 15.2% |
| Immigrants | South Eastern Asia | 93.5 /100 | #116 | Exceptional 15.2% |
| Immigrants | Vietnam | 93.5 /100 | #117 | Exceptional 15.2% |
| Native Hawaiians | 93.4 /100 | #118 | Exceptional 15.2% |
| Belgians | 93.1 /100 | #119 | Exceptional 15.2% |
| South Africans | 93.0 /100 | #120 | Exceptional 15.2% |
| Scottish | 93.0 /100 | #121 | Exceptional 15.2% |
| Immigrants | Malaysia | 92.8 /100 | #122 | Exceptional 15.3% |
| Immigrants | Norway | 92.3 /100 | #123 | Exceptional 15.3% |
| Tlingit-Haida | 92.2 /100 | #124 | Exceptional 15.3% |