Albanian vs Apache Child Poverty Among Boys Under 16
COMPARE
Albanian
Apache
Child Poverty Among Boys Under 16
Child Poverty Among Boys Under 16 Comparison
Albanians
Apache
15.6%
CHILD POVERTY AMONG BOYS UNDER 16
86.5/ 100
METRIC RATING
139th/ 347
METRIC RANK
24.5%
CHILD POVERTY AMONG BOYS UNDER 16
0.0/ 100
METRIC RATING
333rd/ 347
METRIC RANK
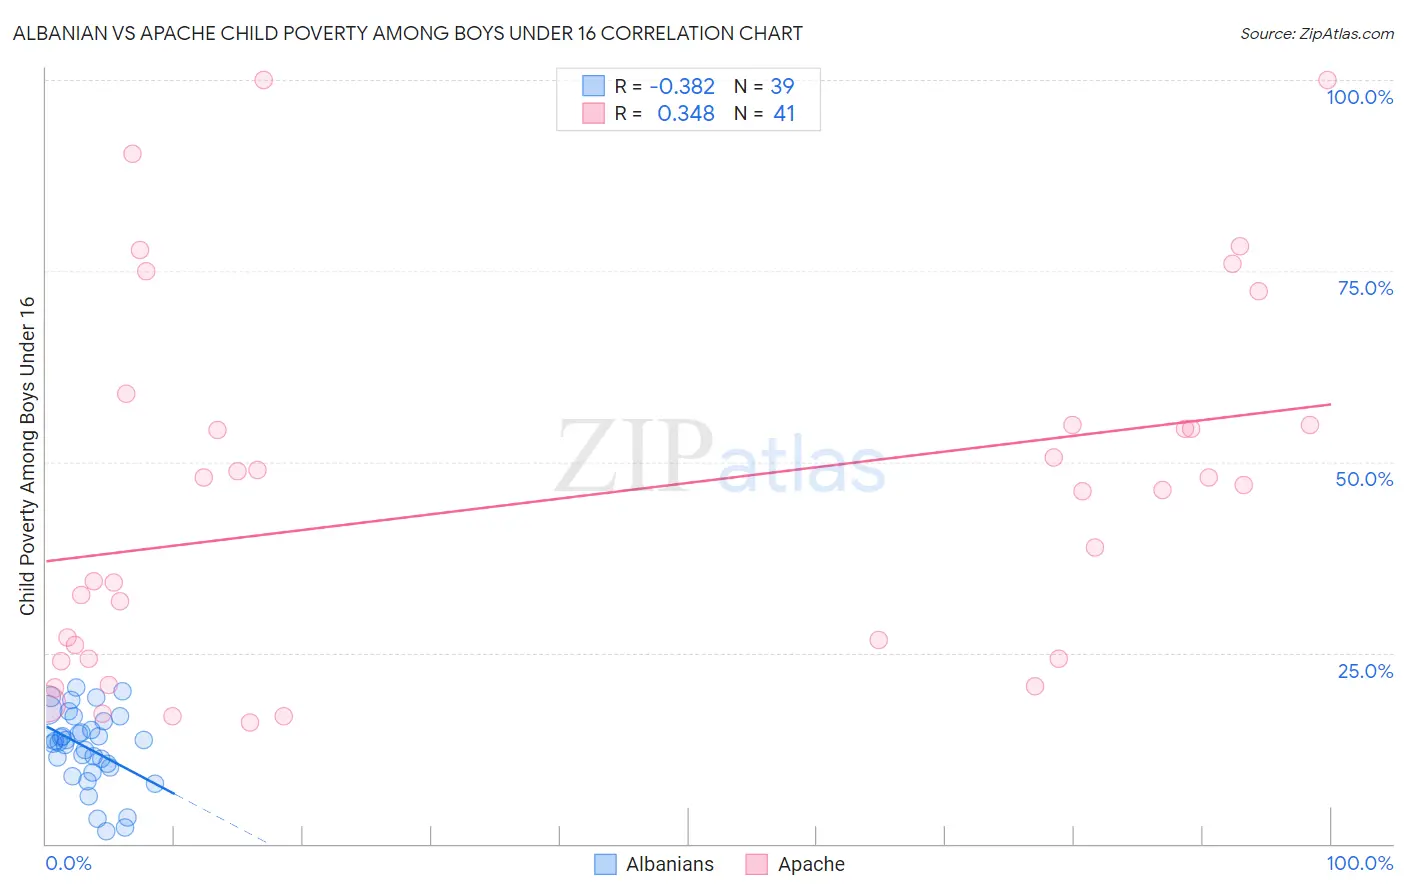
Albanian vs Apache Child Poverty Among Boys Under 16 Correlation Chart
The statistical analysis conducted on geographies consisting of 190,811,063 people shows a mild negative correlation between the proportion of Albanians and poverty level among boys under the age of 16 in the United States with a correlation coefficient (R) of -0.382 and weighted average of 15.6%. Similarly, the statistical analysis conducted on geographies consisting of 229,742,001 people shows a mild positive correlation between the proportion of Apache and poverty level among boys under the age of 16 in the United States with a correlation coefficient (R) of 0.348 and weighted average of 24.5%, a difference of 57.2%.
Child Poverty Among Boys Under 16 Correlation Summary
| Measurement | Albanian | Apache |
| Minimum | 1.7% | 15.9% |
| Maximum | 20.4% | 100.0% |
| Range | 18.7% | 84.1% |
| Mean | 12.6% | 45.2% |
| Median | 13.5% | 46.3% |
| Interquartile 25% (IQ1) | 9.9% | 24.3% |
| Interquartile 75% (IQ3) | 16.0% | 54.8% |
| Interquartile Range (IQR) | 6.1% | 30.6% |
| Standard Deviation (Sample) | 4.8% | 23.6% |
| Standard Deviation (Population) | 4.8% | 23.3% |
Similar Demographics by Child Poverty Among Boys Under 16
Demographics Similar to Albanians by Child Poverty Among Boys Under 16
In terms of child poverty among boys under 16, the demographic groups most similar to Albanians are Immigrants from Southern Europe (15.6%, a difference of 0.010%), Immigrants from Spain (15.6%, a difference of 0.15%), Immigrants from Kuwait (15.6%, a difference of 0.22%), Icelander (15.5%, a difference of 0.25%), and Portuguese (15.5%, a difference of 0.27%).
| Demographics | Rating | Rank | Child Poverty Among Boys Under 16 |
| Immigrants | Kazakhstan | 88.7 /100 | #132 | Excellent 15.5% |
| Welsh | 88.3 /100 | #133 | Excellent 15.5% |
| Peruvians | 88.1 /100 | #134 | Excellent 15.5% |
| Portuguese | 87.5 /100 | #135 | Excellent 15.5% |
| Icelanders | 87.5 /100 | #136 | Excellent 15.5% |
| Immigrants | Spain | 87.1 /100 | #137 | Excellent 15.6% |
| Immigrants | Southern Europe | 86.5 /100 | #138 | Excellent 15.6% |
| Albanians | 86.5 /100 | #139 | Excellent 15.6% |
| Immigrants | Kuwait | 85.6 /100 | #140 | Excellent 15.6% |
| Slavs | 84.5 /100 | #141 | Excellent 15.7% |
| Immigrants | Hungary | 84.1 /100 | #142 | Excellent 15.7% |
| Immigrants | Fiji | 83.6 /100 | #143 | Excellent 15.7% |
| Immigrants | Peru | 83.5 /100 | #144 | Excellent 15.7% |
| Samoans | 83.2 /100 | #145 | Excellent 15.7% |
| New Zealanders | 82.4 /100 | #146 | Excellent 15.7% |
Demographics Similar to Apache by Child Poverty Among Boys Under 16
In terms of child poverty among boys under 16, the demographic groups most similar to Apache are Black/African American (24.5%, a difference of 0.12%), Immigrants from Dominican Republic (24.3%, a difference of 0.72%), Yup'ik (24.7%, a difference of 0.97%), Dominican (24.2%, a difference of 1.3%), and Colville (24.1%, a difference of 1.7%).
| Demographics | Rating | Rank | Child Poverty Among Boys Under 16 |
| Paiute | 0.0 /100 | #326 | Tragic 22.8% |
| Immigrants | Honduras | 0.0 /100 | #327 | Tragic 22.8% |
| Pueblo | 0.0 /100 | #328 | Tragic 23.5% |
| Natives/Alaskans | 0.0 /100 | #329 | Tragic 24.0% |
| Colville | 0.0 /100 | #330 | Tragic 24.1% |
| Dominicans | 0.0 /100 | #331 | Tragic 24.2% |
| Immigrants | Dominican Republic | 0.0 /100 | #332 | Tragic 24.3% |
| Apache | 0.0 /100 | #333 | Tragic 24.5% |
| Blacks/African Americans | 0.0 /100 | #334 | Tragic 24.5% |
| Yup'ik | 0.0 /100 | #335 | Tragic 24.7% |
| Sioux | 0.0 /100 | #336 | Tragic 25.3% |
| Cheyenne | 0.0 /100 | #337 | Tragic 25.8% |
| Hopi | 0.0 /100 | #338 | Tragic 25.9% |
| Houma | 0.0 /100 | #339 | Tragic 26.2% |
| Crow | 0.0 /100 | #340 | Tragic 26.3% |