Alaska Native vs Immigrants from Spain Poverty
COMPARE
Alaska Native
Immigrants from Spain
Poverty
Poverty Comparison
Alaska Natives
Immigrants from Spain
13.5%
POVERTY
2.1/ 100
METRIC RATING
227th/ 347
METRIC RANK
12.3%
POVERTY
51.3/ 100
METRIC RATING
171st/ 347
METRIC RANK
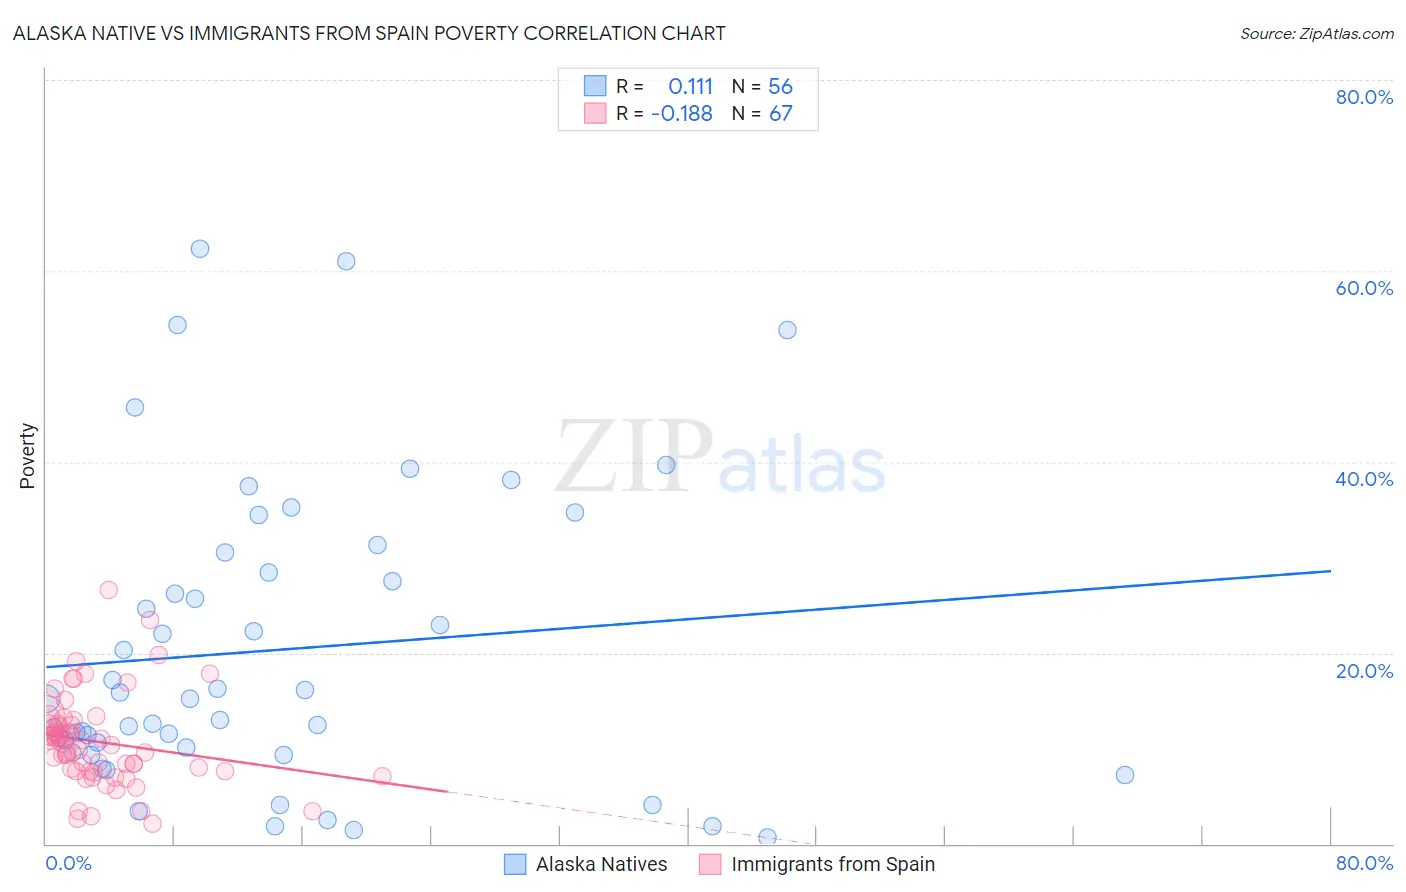
Alaska Native vs Immigrants from Spain Poverty Correlation Chart
The statistical analysis conducted on geographies consisting of 76,760,249 people shows a poor positive correlation between the proportion of Alaska Natives and poverty level in the United States with a correlation coefficient (R) of 0.111 and weighted average of 13.5%. Similarly, the statistical analysis conducted on geographies consisting of 239,619,793 people shows a poor negative correlation between the proportion of Immigrants from Spain and poverty level in the United States with a correlation coefficient (R) of -0.188 and weighted average of 12.3%, a difference of 9.5%.
Poverty Correlation Summary
| Measurement | Alaska Native | Immigrants from Spain |
| Minimum | 0.63% | 2.1% |
| Maximum | 62.3% | 26.5% |
| Range | 61.6% | 24.5% |
| Mean | 20.3% | 10.7% |
| Median | 15.2% | 10.5% |
| Interquartile 25% (IQ1) | 9.8% | 7.6% |
| Interquartile 75% (IQ3) | 29.5% | 12.6% |
| Interquartile Range (IQR) | 19.7% | 5.0% |
| Standard Deviation (Sample) | 15.5% | 4.7% |
| Standard Deviation (Population) | 15.4% | 4.7% |
Similar Demographics by Poverty
Demographics Similar to Alaska Natives by Poverty
In terms of poverty, the demographic groups most similar to Alaska Natives are Marshallese (13.4%, a difference of 0.15%), German Russian (13.4%, a difference of 0.16%), Immigrants from Eritrea (13.4%, a difference of 0.38%), Immigrants from Nigeria (13.5%, a difference of 0.45%), and Immigrants from Africa (13.4%, a difference of 0.48%).
| Demographics | Rating | Rank | Poverty |
| Americans | 2.9 /100 | #220 | Tragic 13.4% |
| Alsatians | 2.6 /100 | #221 | Tragic 13.4% |
| Immigrants | Micronesia | 2.6 /100 | #222 | Tragic 13.4% |
| Immigrants | Africa | 2.5 /100 | #223 | Tragic 13.4% |
| Immigrants | Eritrea | 2.4 /100 | #224 | Tragic 13.4% |
| German Russians | 2.2 /100 | #225 | Tragic 13.4% |
| Marshallese | 2.2 /100 | #226 | Tragic 13.4% |
| Alaska Natives | 2.1 /100 | #227 | Tragic 13.5% |
| Immigrants | Nigeria | 1.7 /100 | #228 | Tragic 13.5% |
| Osage | 1.5 /100 | #229 | Tragic 13.6% |
| Alaskan Athabascans | 1.5 /100 | #230 | Tragic 13.6% |
| Nigerians | 1.4 /100 | #231 | Tragic 13.6% |
| Fijians | 0.8 /100 | #232 | Tragic 13.7% |
| Immigrants | Saudi Arabia | 0.8 /100 | #233 | Tragic 13.8% |
| Immigrants | Laos | 0.7 /100 | #234 | Tragic 13.8% |
Demographics Similar to Immigrants from Spain by Poverty
In terms of poverty, the demographic groups most similar to Immigrants from Spain are Immigrants from Portugal (12.3%, a difference of 0.070%), Celtic (12.3%, a difference of 0.11%), Lebanese (12.3%, a difference of 0.12%), South American (12.3%, a difference of 0.25%), and Immigrants from Oceania (12.3%, a difference of 0.32%).
| Demographics | Rating | Rank | Poverty |
| Colombians | 57.8 /100 | #164 | Average 12.2% |
| Immigrants | Albania | 57.7 /100 | #165 | Average 12.2% |
| Venezuelans | 56.9 /100 | #166 | Average 12.2% |
| Immigrants | Chile | 56.7 /100 | #167 | Average 12.2% |
| Immigrants | Venezuela | 56.5 /100 | #168 | Average 12.2% |
| Whites/Caucasians | 55.4 /100 | #169 | Average 12.3% |
| Immigrants | Oceania | 54.6 /100 | #170 | Average 12.3% |
| Immigrants | Spain | 51.3 /100 | #171 | Average 12.3% |
| Immigrants | Portugal | 50.5 /100 | #172 | Average 12.3% |
| Celtics | 50.1 /100 | #173 | Average 12.3% |
| Lebanese | 50.0 /100 | #174 | Average 12.3% |
| South Americans | 48.7 /100 | #175 | Average 12.3% |
| Immigrants | Colombia | 47.7 /100 | #176 | Average 12.3% |
| Immigrants | Syria | 47.5 /100 | #177 | Average 12.3% |
| Uruguayans | 44.7 /100 | #178 | Average 12.4% |