Alaska Native vs Chippewa Disability Age 65 to 74
COMPARE
Alaska Native
Chippewa
Disability Age 65 to 74
Disability Age 65 to 74 Comparison
Alaska Natives
Chippewa
30.6%
DISABILITY AGE 65 TO 74
0.0/ 100
METRIC RATING
334th/ 347
METRIC RANK
27.8%
DISABILITY AGE 65 TO 74
0.0/ 100
METRIC RATING
314th/ 347
METRIC RANK
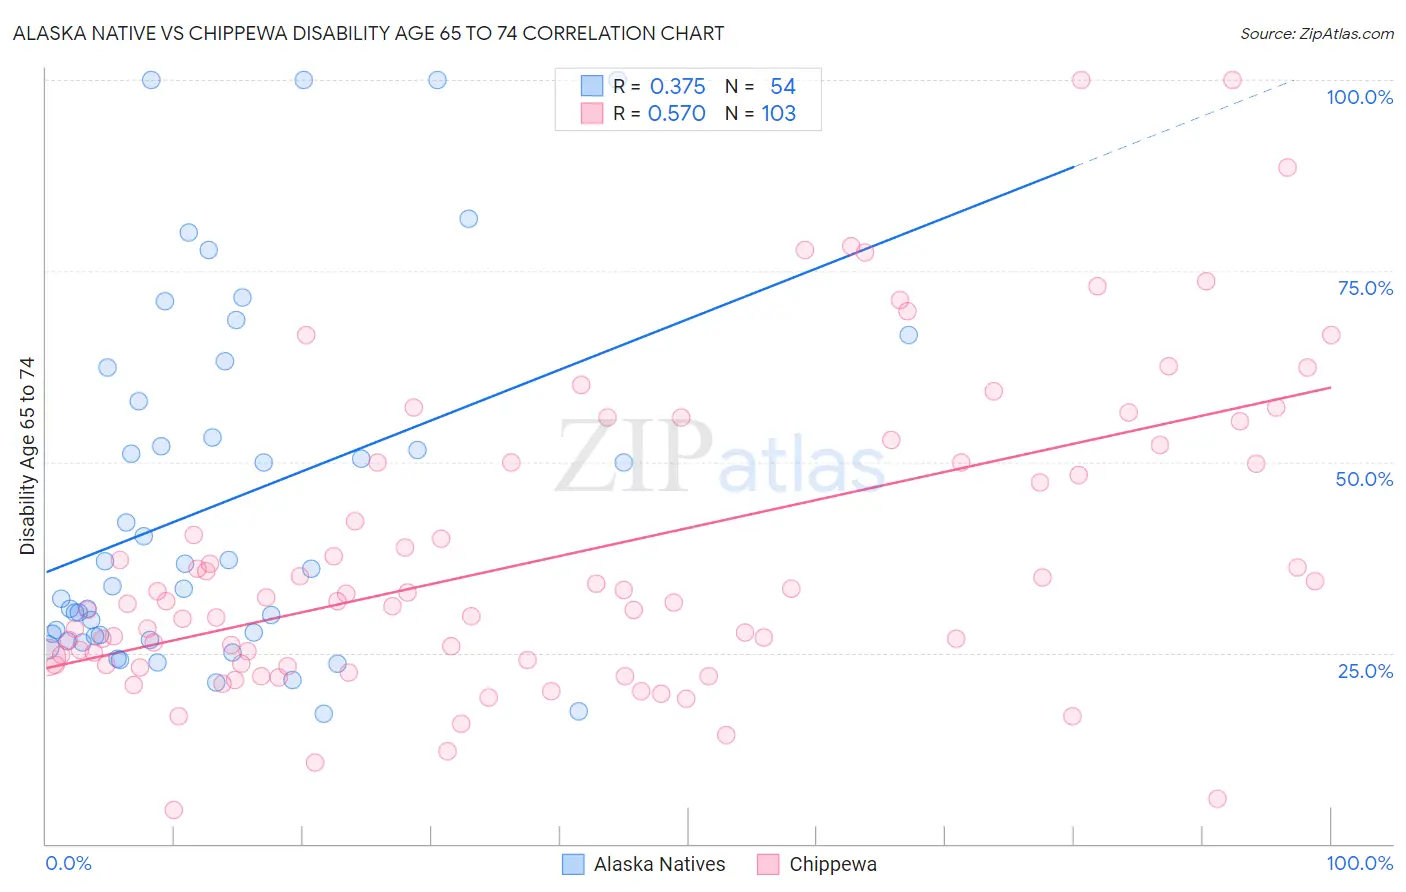
Alaska Native vs Chippewa Disability Age 65 to 74 Correlation Chart
The statistical analysis conducted on geographies consisting of 76,681,406 people shows a mild positive correlation between the proportion of Alaska Natives and percentage of population with a disability between the ages 65 and 75 in the United States with a correlation coefficient (R) of 0.375 and weighted average of 30.6%. Similarly, the statistical analysis conducted on geographies consisting of 214,741,150 people shows a substantial positive correlation between the proportion of Chippewa and percentage of population with a disability between the ages 65 and 75 in the United States with a correlation coefficient (R) of 0.570 and weighted average of 27.8%, a difference of 10.2%.
Disability Age 65 to 74 Correlation Summary
| Measurement | Alaska Native | Chippewa |
| Minimum | 16.9% | 4.3% |
| Maximum | 100.0% | 100.0% |
| Range | 83.1% | 95.7% |
| Mean | 44.6% | 37.7% |
| Median | 34.9% | 31.7% |
| Interquartile 25% (IQ1) | 27.2% | 23.6% |
| Interquartile 75% (IQ3) | 58.0% | 50.0% |
| Interquartile Range (IQR) | 30.8% | 26.4% |
| Standard Deviation (Sample) | 23.4% | 19.8% |
| Standard Deviation (Population) | 23.2% | 19.8% |
Demographics Similar to Alaska Natives and Chippewa by Disability Age 65 to 74
In terms of disability age 65 to 74, the demographic groups most similar to Alaska Natives are Colville (30.5%, a difference of 0.25%), Native/Alaskan (30.4%, a difference of 0.77%), Chickasaw (30.2%, a difference of 1.4%), Creek (30.2%, a difference of 1.4%), and Choctaw (30.2%, a difference of 1.4%). Similarly, the demographic groups most similar to Chippewa are Cajun (27.9%, a difference of 0.47%), Crow (27.9%, a difference of 0.52%), Immigrants from Armenia (28.0%, a difference of 0.60%), Nepalese (28.0%, a difference of 0.83%), and Arapaho (28.1%, a difference of 1.1%).
| Demographics | Rating | Rank | Disability Age 65 to 74 |
| Chippewa | 0.0 /100 | #314 | Tragic 27.8% |
| Cajuns | 0.0 /100 | #315 | Tragic 27.9% |
| Crow | 0.0 /100 | #316 | Tragic 27.9% |
| Immigrants | Armenia | 0.0 /100 | #317 | Tragic 28.0% |
| Nepalese | 0.0 /100 | #318 | Tragic 28.0% |
| Arapaho | 0.0 /100 | #319 | Tragic 28.1% |
| Cherokee | 0.0 /100 | #320 | Tragic 28.2% |
| Comanche | 0.0 /100 | #321 | Tragic 28.3% |
| Aleuts | 0.0 /100 | #322 | Tragic 28.4% |
| Puerto Ricans | 0.0 /100 | #323 | Tragic 29.1% |
| Seminole | 0.0 /100 | #324 | Tragic 29.4% |
| Dutch West Indians | 0.0 /100 | #325 | Tragic 29.6% |
| Yakama | 0.0 /100 | #326 | Tragic 29.6% |
| Apache | 0.0 /100 | #327 | Tragic 29.7% |
| Hopi | 0.0 /100 | #328 | Tragic 30.0% |
| Choctaw | 0.0 /100 | #329 | Tragic 30.2% |
| Creek | 0.0 /100 | #330 | Tragic 30.2% |
| Chickasaw | 0.0 /100 | #331 | Tragic 30.2% |
| Natives/Alaskans | 0.0 /100 | #332 | Tragic 30.4% |
| Colville | 0.0 /100 | #333 | Tragic 30.5% |
| Alaska Natives | 0.0 /100 | #334 | Tragic 30.6% |