Afghan vs Immigrants from Europe 10th Grade
COMPARE
Afghan
Immigrants from Europe
10th Grade
10th Grade Comparison
Afghans
Immigrants from Europe
93.1%
10TH GRADE
4.5/ 100
METRIC RATING
236th/ 347
METRIC RANK
94.5%
10TH GRADE
97.5/ 100
METRIC RATING
103rd/ 347
METRIC RANK
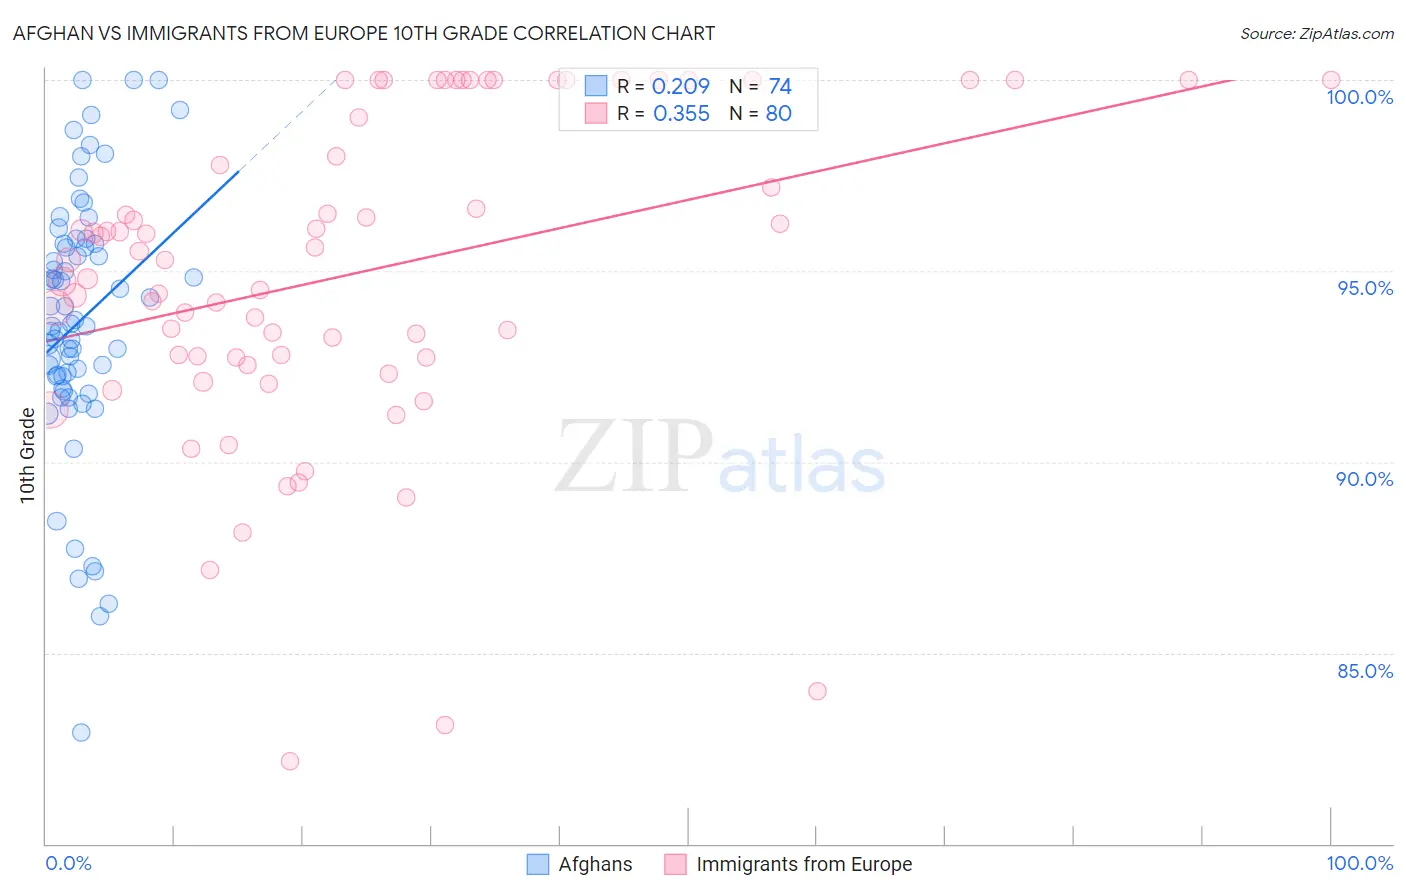
Afghan vs Immigrants from Europe 10th Grade Correlation Chart
The statistical analysis conducted on geographies consisting of 148,851,685 people shows a weak positive correlation between the proportion of Afghans and percentage of population with at least 10th grade education in the United States with a correlation coefficient (R) of 0.209 and weighted average of 93.1%. Similarly, the statistical analysis conducted on geographies consisting of 547,425,973 people shows a mild positive correlation between the proportion of Immigrants from Europe and percentage of population with at least 10th grade education in the United States with a correlation coefficient (R) of 0.355 and weighted average of 94.5%, a difference of 1.5%.
10th Grade Correlation Summary
| Measurement | Afghan | Immigrants from Europe |
| Minimum | 82.9% | 82.2% |
| Maximum | 100.0% | 100.0% |
| Range | 17.1% | 17.8% |
| Mean | 93.7% | 95.0% |
| Median | 93.6% | 95.3% |
| Interquartile 25% (IQ1) | 92.2% | 92.7% |
| Interquartile 75% (IQ3) | 95.7% | 99.5% |
| Interquartile Range (IQR) | 3.5% | 6.8% |
| Standard Deviation (Sample) | 3.4% | 4.2% |
| Standard Deviation (Population) | 3.4% | 4.2% |
Similar Demographics by 10th Grade
Demographics Similar to Afghans by 10th Grade
In terms of 10th grade, the demographic groups most similar to Afghans are African (93.1%, a difference of 0.0%), Subsaharan African (93.1%, a difference of 0.010%), Immigrants from Panama (93.1%, a difference of 0.010%), Immigrants from Africa (93.1%, a difference of 0.020%), and South American Indian (93.1%, a difference of 0.020%).
| Demographics | Rating | Rank | 10th Grade |
| Immigrants | Ethiopia | 5.1 /100 | #229 | Tragic 93.1% |
| Immigrants | Africa | 5.0 /100 | #230 | Tragic 93.1% |
| South American Indians | 4.9 /100 | #231 | Tragic 93.1% |
| Bahamians | 4.9 /100 | #232 | Tragic 93.1% |
| Comanche | 4.9 /100 | #233 | Tragic 93.1% |
| Sub-Saharan Africans | 4.7 /100 | #234 | Tragic 93.1% |
| Africans | 4.6 /100 | #235 | Tragic 93.1% |
| Afghans | 4.5 /100 | #236 | Tragic 93.1% |
| Immigrants | Panama | 4.3 /100 | #237 | Tragic 93.1% |
| Nigerians | 4.2 /100 | #238 | Tragic 93.1% |
| Costa Ricans | 4.2 /100 | #239 | Tragic 93.1% |
| Immigrants | Hong Kong | 4.2 /100 | #240 | Tragic 93.1% |
| Immigrants | Somalia | 2.7 /100 | #241 | Tragic 93.0% |
| Immigrants | Cameroon | 2.6 /100 | #242 | Tragic 93.0% |
| Senegalese | 2.4 /100 | #243 | Tragic 93.0% |
Demographics Similar to Immigrants from Europe by 10th Grade
In terms of 10th grade, the demographic groups most similar to Immigrants from Europe are Immigrants from Romania (94.5%, a difference of 0.0%), Immigrants from Turkey (94.5%, a difference of 0.010%), Immigrants from Serbia (94.5%, a difference of 0.010%), Immigrants from Croatia (94.5%, a difference of 0.010%), and Syrian (94.5%, a difference of 0.020%).
| Demographics | Rating | Rank | 10th Grade |
| Immigrants | Switzerland | 98.3 /100 | #96 | Exceptional 94.6% |
| Lebanese | 98.3 /100 | #97 | Exceptional 94.6% |
| Immigrants | Bulgaria | 98.1 /100 | #98 | Exceptional 94.6% |
| Immigrants | France | 97.9 /100 | #99 | Exceptional 94.5% |
| Immigrants | South Central Asia | 97.8 /100 | #100 | Exceptional 94.5% |
| Syrians | 97.7 /100 | #101 | Exceptional 94.5% |
| Cambodians | 97.6 /100 | #102 | Exceptional 94.5% |
| Immigrants | Europe | 97.5 /100 | #103 | Exceptional 94.5% |
| Immigrants | Romania | 97.5 /100 | #104 | Exceptional 94.5% |
| Immigrants | Turkey | 97.4 /100 | #105 | Exceptional 94.5% |
| Immigrants | Serbia | 97.4 /100 | #106 | Exceptional 94.5% |
| Immigrants | Croatia | 97.4 /100 | #107 | Exceptional 94.5% |
| Immigrants | North Macedonia | 97.2 /100 | #108 | Exceptional 94.5% |
| Immigrants | Norway | 97.2 /100 | #109 | Exceptional 94.5% |
| Burmese | 97.1 /100 | #110 | Exceptional 94.5% |