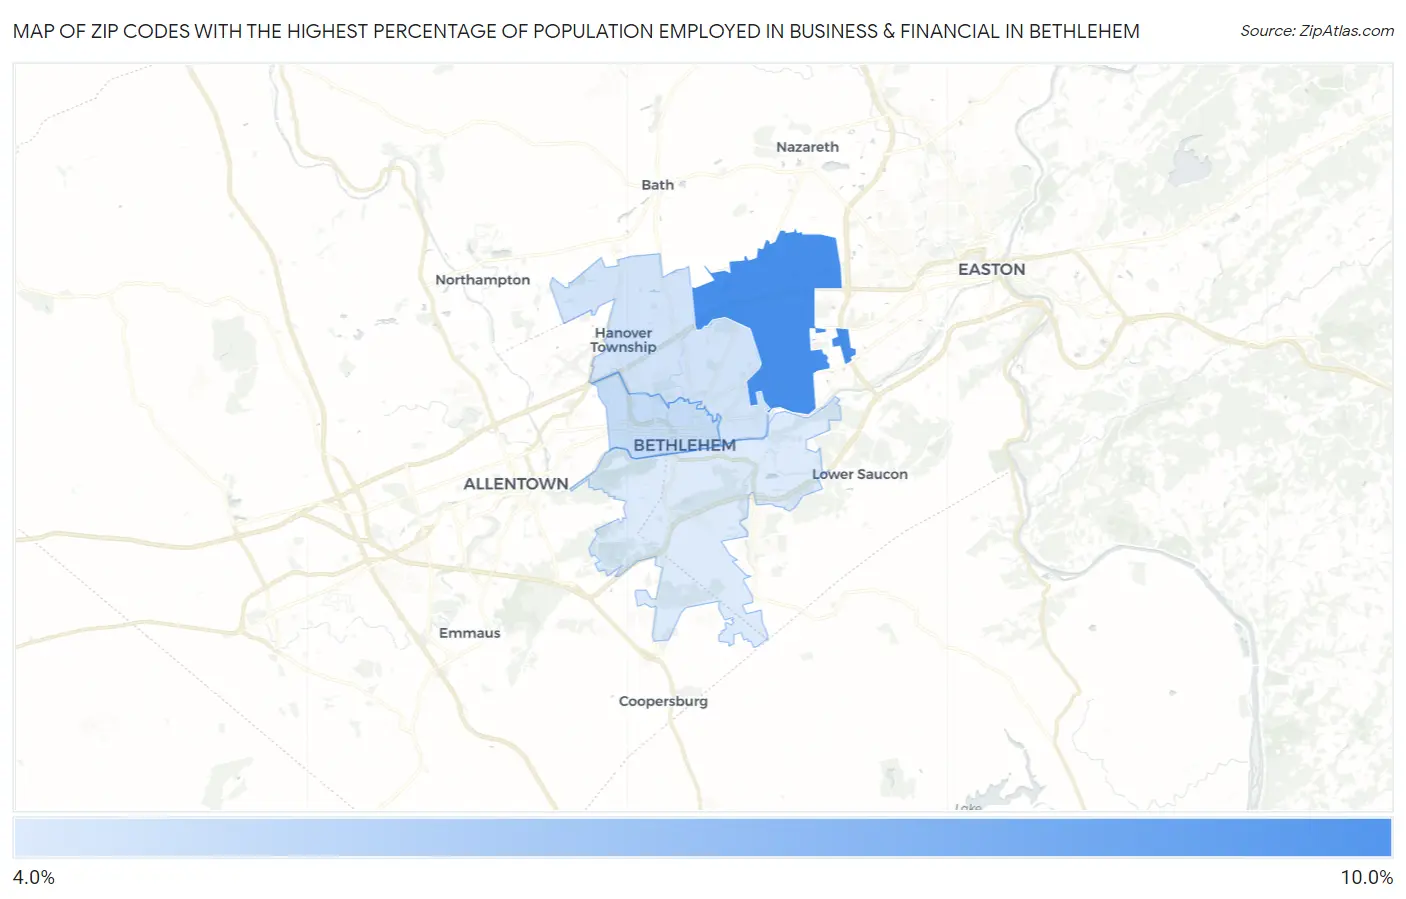
Zip Codes with the Highest Percentage of Population Employed in Business & Financial in Bethlehem, PA
RELATED REPORTS & OPTIONS
Business & Financial
Bethlehem
Compare Zip Codes
Map of Zip Codes with the Highest Percentage of Population Employed in Business & Financial in Bethlehem
4.5%
8.9%
Zip Codes with the Highest Percentage of Population Employed in Business & Financial in Bethlehem, PA
| Zip Code | % Employed | vs State | vs National | |
| 1. | 18020 | 8.9% | 5.9%(+3.00)#191 | 5.8%(+3.13)#3,187 |
| 2. | 18018 | 5.1% | 5.9%(-0.793)#566 | 5.8%(-0.662)#10,189 |
| 3. | 18017 | 4.8% | 5.9%(-1.13)#628 | 5.8%(-0.994)#11,185 |
| 4. | 18015 | 4.5% | 5.9%(-1.44)#686 | 5.8%(-1.31)#12,255 |
1
Common Questions
What are the Top 3 Zip Codes with the Highest Percentage of Population Employed in Business & Financial in Bethlehem, PA?
Top 3 Zip Codes with the Highest Percentage of Population Employed in Business & Financial in Bethlehem, PA are:
What zip code has the Highest Percentage of Population Employed in Business & Financial in Bethlehem, PA?
18020 has the Highest Percentage of Population Employed in Business & Financial in Bethlehem, PA with 8.9%.
What is the Percentage of Population Employed in Business & Financial in Bethlehem, PA?
Percentage of Population Employed in Business & Financial in Bethlehem is 4.6%.
What is the Percentage of Population Employed in Business & Financial in Pennsylvania?
Percentage of Population Employed in Business & Financial in Pennsylvania is 5.9%.
What is the Percentage of Population Employed in Business & Financial in the United States?
Percentage of Population Employed in Business & Financial in the United States is 5.8%.