Zip Codes with the Highest Percentage of Population Employed in Professional & Scientific Services in Bethlehem, PA
RELATED REPORTS & OPTIONS
Professional & Scientific Services
Bethlehem
Compare Zip Codes
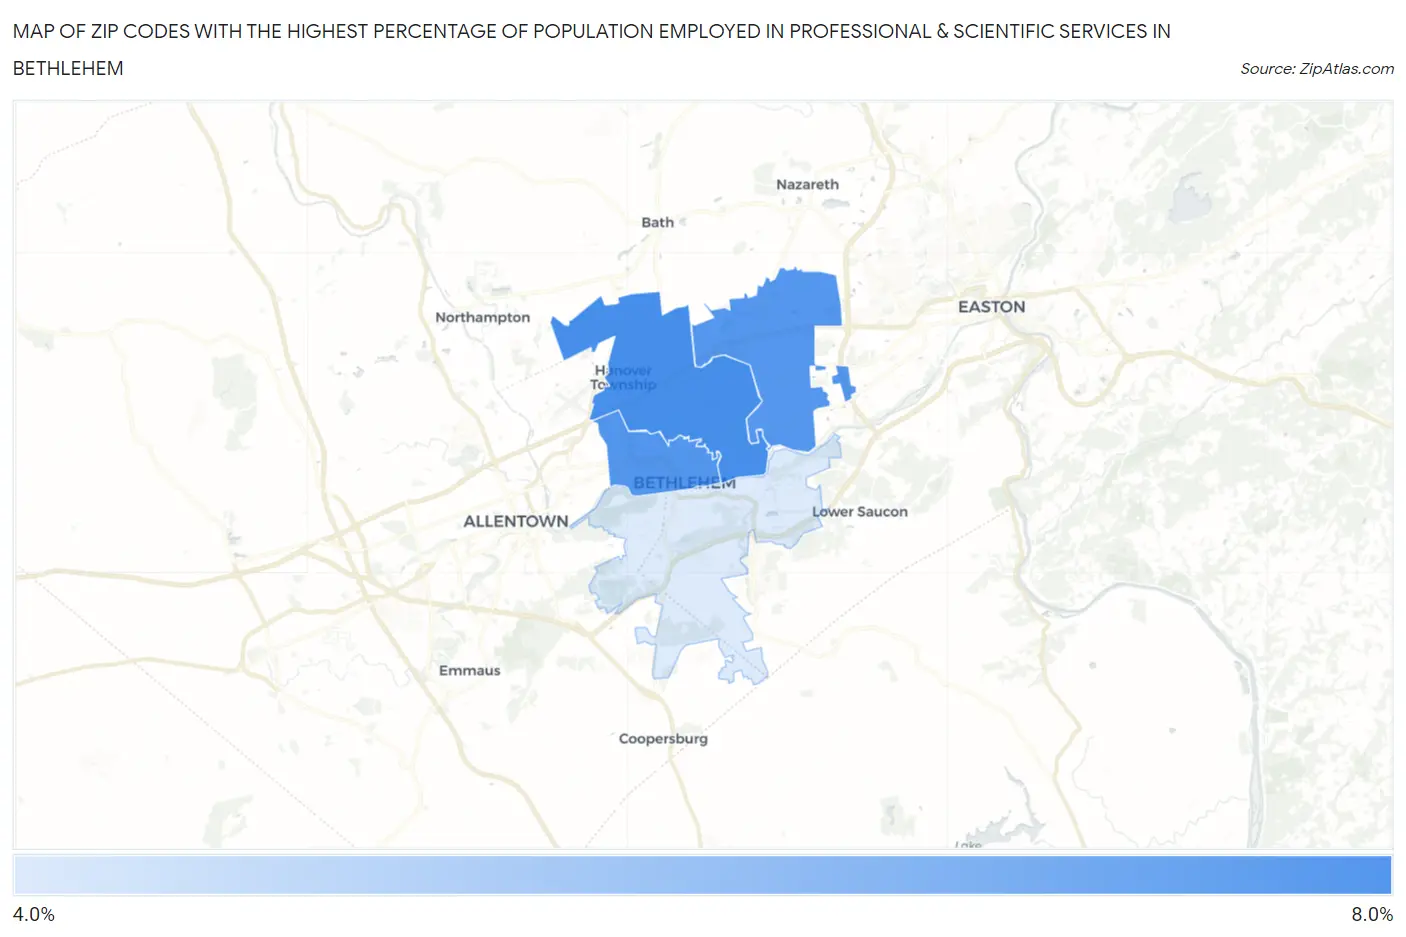
Map of Zip Codes with the Highest Percentage of Population Employed in Professional & Scientific Services in Bethlehem
4.2%
6.8%
Zip Codes with the Highest Percentage of Population Employed in Professional & Scientific Services in Bethlehem, PA
| Zip Code | % Employed | vs State | vs National | |
| 1. | 18017 | 6.8% | 7.1%(-0.365)#430 | 7.8%(-1.08)#8,538 |
| 2. | 18018 | 6.6% | 7.1%(-0.579)#453 | 7.8%(-1.29)#8,926 |
| 3. | 18020 | 6.5% | 7.1%(-0.603)#458 | 7.8%(-1.32)#8,985 |
| 4. | 18015 | 4.2% | 7.1%(-2.92)#775 | 7.8%(-3.63)#14,473 |
1
Common Questions
What are the Top 3 Zip Codes with the Highest Percentage of Population Employed in Professional & Scientific Services in Bethlehem, PA?
Top 3 Zip Codes with the Highest Percentage of Population Employed in Professional & Scientific Services in Bethlehem, PA are:
What zip code has the Highest Percentage of Population Employed in Professional & Scientific Services in Bethlehem, PA?
18017 has the Highest Percentage of Population Employed in Professional & Scientific Services in Bethlehem, PA with 6.8%.
What is the Percentage of Population Employed in Professional & Scientific Services in Bethlehem, PA?
Percentage of Population Employed in Professional & Scientific Services in Bethlehem is 5.6%.
What is the Percentage of Population Employed in Professional & Scientific Services in Pennsylvania?
Percentage of Population Employed in Professional & Scientific Services in Pennsylvania is 7.1%.
What is the Percentage of Population Employed in Professional & Scientific Services in the United States?
Percentage of Population Employed in Professional & Scientific Services in the United States is 7.8%.