Zip Codes with the Highest Percentage of Households Without a Vehicle in Floral Park, NY
RELATED REPORTS & OPTIONS
Households without a Cars
Floral Park
Compare Zip Codes
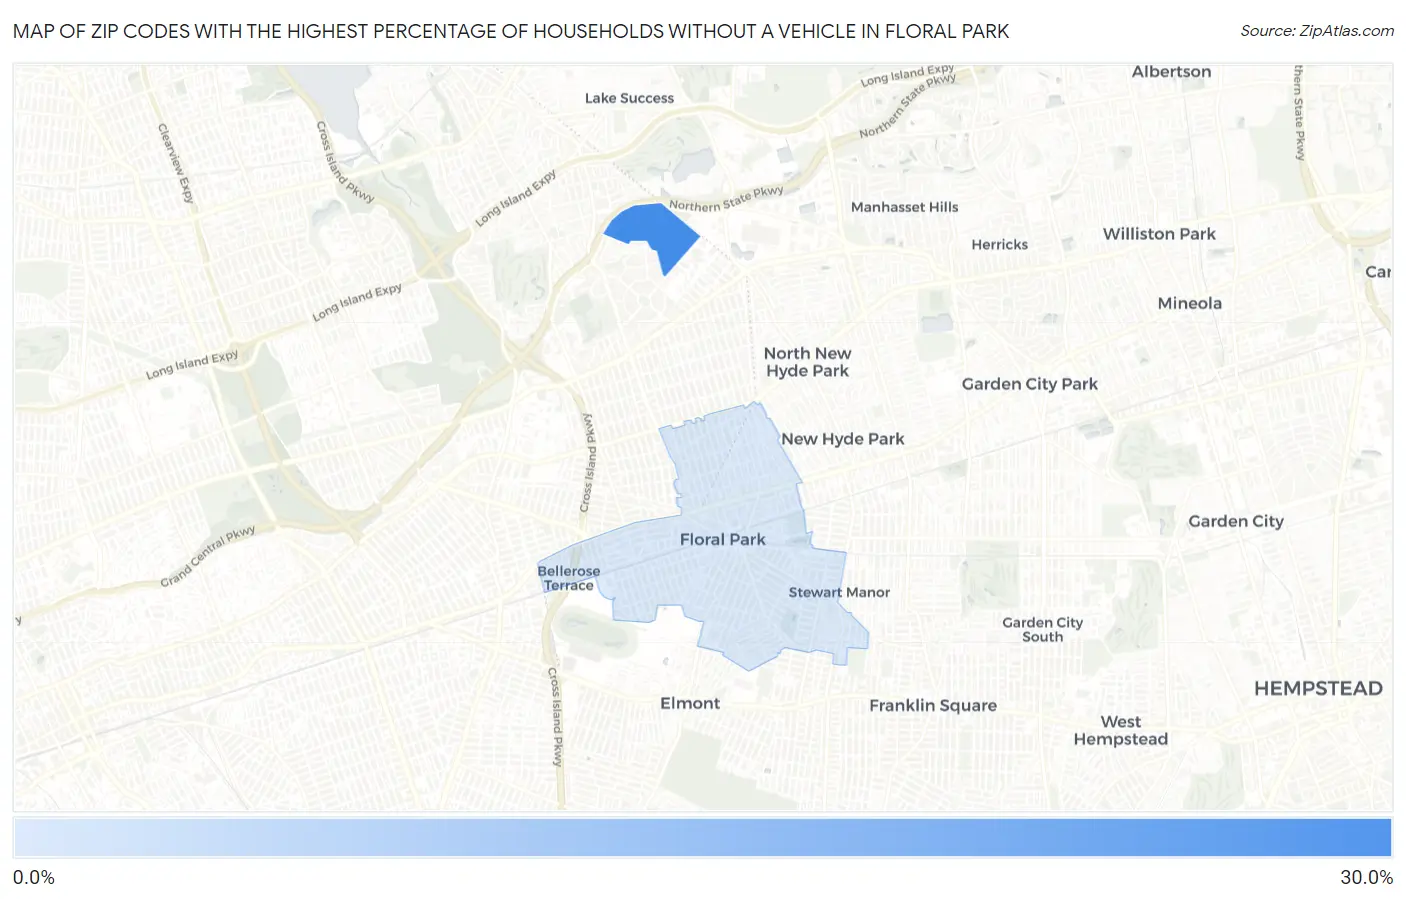
Map of Zip Codes with the Highest Percentage of Households Without a Vehicle in Floral Park
5.8%
26.1%
Zip Codes with the Highest Percentage of Households Without a Vehicle in Floral Park, NY
| Zip Code | Housholds Without a Car | vs State | vs National | |
| 1. | 11005 | 26.1% | 29.0%(-2.90)#196 | 8.3%(+17.8)#991 |
| 2. | 11001 | 5.8% | 29.0%(-23.2)#842 | 8.3%(-2.50)#10,912 |
1
Common Questions
What are the Top Zip Codes with the Highest Percentage of Households Without a Vehicle in Floral Park, NY?
Top Zip Codes with the Highest Percentage of Households Without a Vehicle in Floral Park, NY are:
What zip code has the Highest Percentage of Households Without a Vehicle in Floral Park, NY?
11005 has the Highest Percentage of Households Without a Vehicle in Floral Park, NY with 26.1%.
What is the Percentage of Households Without a Vehicle in Floral Park, NY?
Percentage of Households Without a Vehicle in Floral Park is 7.0%.
What is the Percentage of Households Without a Vehicle in New York?
Percentage of Households Without a Vehicle in New York is 29.0%.
What is the Percentage of Households Without a Vehicle in the United States?
Percentage of Households Without a Vehicle in the United States is 8.3%.