Zip Codes with the Highest Percentage of Population Employed in Administrative & Support Services in Chesterfield, MO
RELATED REPORTS & OPTIONS
Administrative & Support Services
Chesterfield
Compare Zip Codes
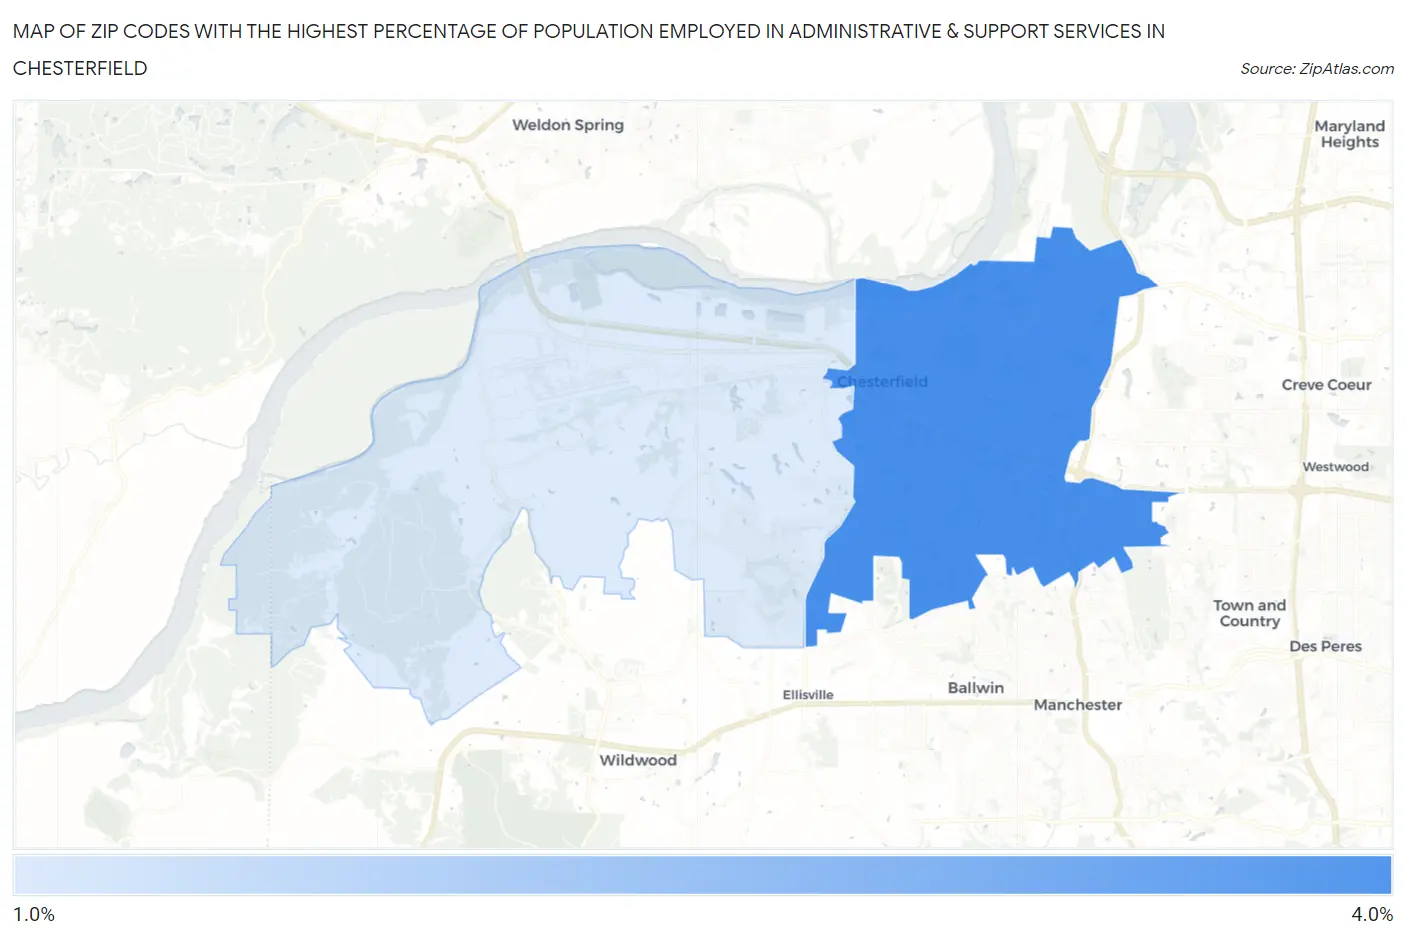
Map of Zip Codes with the Highest Percentage of Population Employed in Administrative & Support Services in Chesterfield
1.9%
3.5%
Zip Codes with the Highest Percentage of Population Employed in Administrative & Support Services in Chesterfield, MO
| Zip Code | % Employed | vs State | vs National | |
| 1. | 63017 | 3.5% | 3.6%(-0.073)#335 | 4.1%(-0.639)#12,909 |
| 2. | 63005 | 1.9% | 3.6%(-1.67)#572 | 4.1%(-2.24)#21,022 |
1
Common Questions
What are the Top Zip Codes with the Highest Percentage of Population Employed in Administrative & Support Services in Chesterfield, MO?
Top Zip Codes with the Highest Percentage of Population Employed in Administrative & Support Services in Chesterfield, MO are:
What zip code has the Highest Percentage of Population Employed in Administrative & Support Services in Chesterfield, MO?
63017 has the Highest Percentage of Population Employed in Administrative & Support Services in Chesterfield, MO with 3.5%.
What is the Percentage of Population Employed in Administrative & Support Services in Chesterfield, MO?
Percentage of Population Employed in Administrative & Support Services in Chesterfield is 3.2%.
What is the Percentage of Population Employed in Administrative & Support Services in Missouri?
Percentage of Population Employed in Administrative & Support Services in Missouri is 3.6%.
What is the Percentage of Population Employed in Administrative & Support Services in the United States?
Percentage of Population Employed in Administrative & Support Services in the United States is 4.1%.