Yup'ik vs Immigrants from Western Asia In Labor Force | Age 20-24
COMPARE
Yup'ik
Immigrants from Western Asia
In Labor Force | Age 20-24
In Labor Force | Age 20-24 Comparison
Yup'ik
Immigrants from Western Asia
70.9%
IN LABOR FORCE | AGE 20-24
0.0/ 100
METRIC RATING
329th/ 347
METRIC RANK
73.5%
IN LABOR FORCE | AGE 20-24
0.4/ 100
METRIC RATING
267th/ 347
METRIC RANK
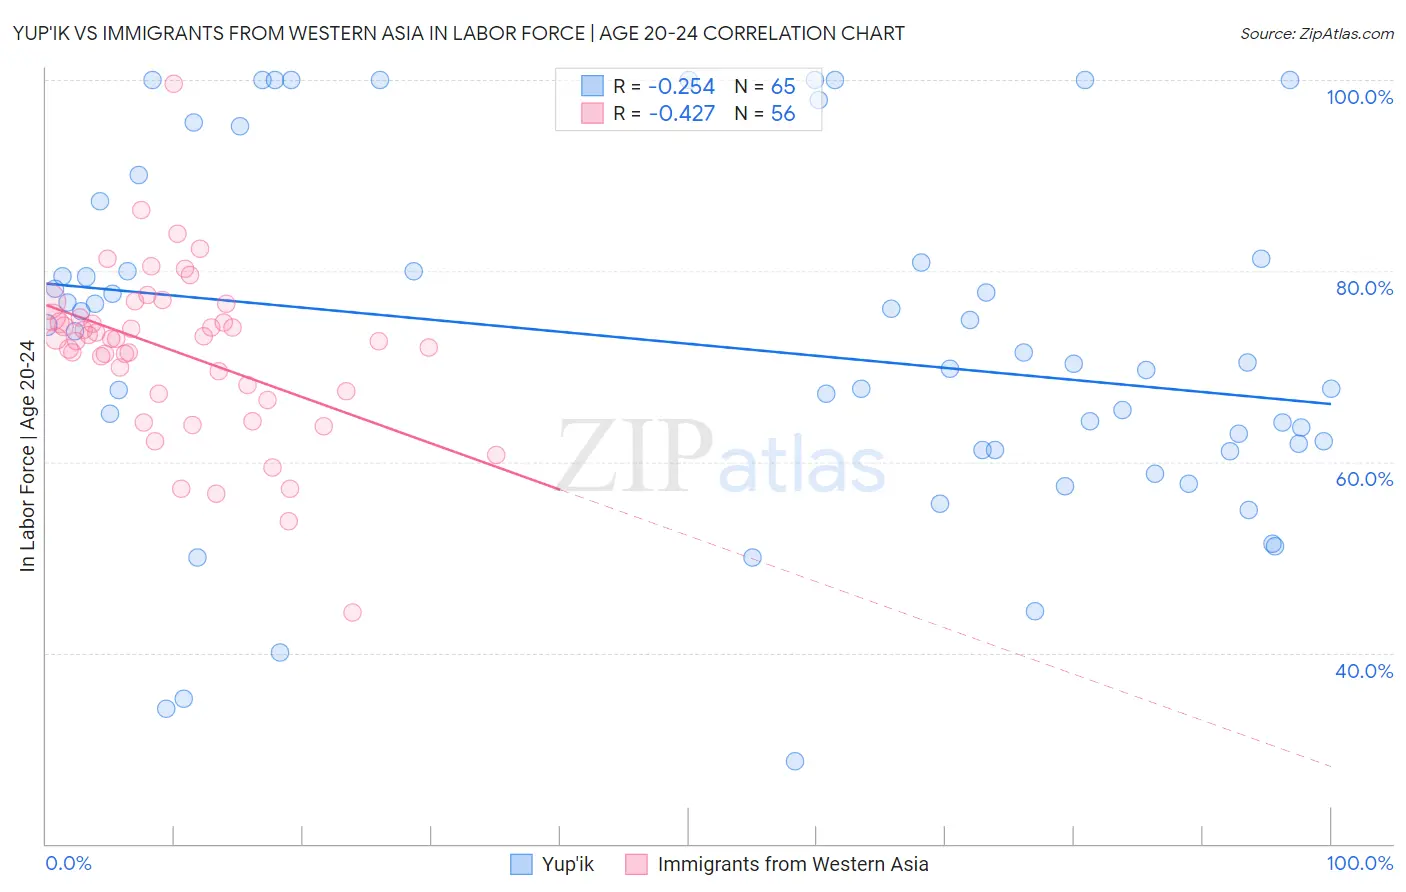
Yup'ik vs Immigrants from Western Asia In Labor Force | Age 20-24 Correlation Chart
The statistical analysis conducted on geographies consisting of 39,958,192 people shows a weak negative correlation between the proportion of Yup'ik and labor force participation rate among population between the ages 20 and 24 in the United States with a correlation coefficient (R) of -0.254 and weighted average of 70.9%. Similarly, the statistical analysis conducted on geographies consisting of 404,272,656 people shows a moderate negative correlation between the proportion of Immigrants from Western Asia and labor force participation rate among population between the ages 20 and 24 in the United States with a correlation coefficient (R) of -0.427 and weighted average of 73.5%, a difference of 3.7%.
In Labor Force | Age 20-24 Correlation Summary
| Measurement | Yup'ik | Immigrants from Western Asia |
| Minimum | 28.6% | 44.2% |
| Maximum | 100.0% | 99.6% |
| Range | 71.4% | 55.4% |
| Mean | 72.2% | 71.5% |
| Median | 70.4% | 72.9% |
| Interquartile 25% (IQ1) | 61.3% | 67.3% |
| Interquartile 75% (IQ3) | 81.1% | 75.1% |
| Interquartile Range (IQR) | 19.8% | 7.9% |
| Standard Deviation (Sample) | 18.2% | 8.7% |
| Standard Deviation (Population) | 18.1% | 8.7% |
Similar Demographics by In Labor Force | Age 20-24
Demographics Similar to Yup'ik by In Labor Force | Age 20-24
In terms of in labor force | age 20-24, the demographic groups most similar to Yup'ik are Immigrants from China (71.1%, a difference of 0.24%), Dominican (71.1%, a difference of 0.26%), Immigrants from Trinidad and Tobago (71.1%, a difference of 0.26%), Barbadian (71.1%, a difference of 0.35%), and Vietnamese (70.6%, a difference of 0.35%).
| Demographics | Rating | Rank | In Labor Force | Age 20-24 |
| Filipinos | 0.0 /100 | #322 | Tragic 71.4% |
| West Indians | 0.0 /100 | #323 | Tragic 71.3% |
| Immigrants | Dominican Republic | 0.0 /100 | #324 | Tragic 71.2% |
| Barbadians | 0.0 /100 | #325 | Tragic 71.1% |
| Dominicans | 0.0 /100 | #326 | Tragic 71.1% |
| Immigrants | Trinidad and Tobago | 0.0 /100 | #327 | Tragic 71.1% |
| Immigrants | China | 0.0 /100 | #328 | Tragic 71.1% |
| Yup'ik | 0.0 /100 | #329 | Tragic 70.9% |
| Vietnamese | 0.0 /100 | #330 | Tragic 70.6% |
| Immigrants | Bangladesh | 0.0 /100 | #331 | Tragic 70.6% |
| Immigrants | Uzbekistan | 0.0 /100 | #332 | Tragic 70.4% |
| Yuman | 0.0 /100 | #333 | Tragic 70.3% |
| British West Indians | 0.0 /100 | #334 | Tragic 70.0% |
| Immigrants | Barbados | 0.0 /100 | #335 | Tragic 69.7% |
| Immigrants | Guyana | 0.0 /100 | #336 | Tragic 69.3% |
Demographics Similar to Immigrants from Western Asia by In Labor Force | Age 20-24
In terms of in labor force | age 20-24, the demographic groups most similar to Immigrants from Western Asia are Burmese (73.6%, a difference of 0.040%), Haitian (73.6%, a difference of 0.040%), Immigrants from Haiti (73.6%, a difference of 0.050%), South American (73.5%, a difference of 0.050%), and Immigrants from Asia (73.6%, a difference of 0.070%).
| Demographics | Rating | Rank | In Labor Force | Age 20-24 |
| Immigrants | Turkey | 0.7 /100 | #260 | Tragic 73.7% |
| Houma | 0.6 /100 | #261 | Tragic 73.7% |
| Asians | 0.6 /100 | #262 | Tragic 73.7% |
| Immigrants | Asia | 0.5 /100 | #263 | Tragic 73.6% |
| Immigrants | Haiti | 0.5 /100 | #264 | Tragic 73.6% |
| Burmese | 0.5 /100 | #265 | Tragic 73.6% |
| Haitians | 0.5 /100 | #266 | Tragic 73.6% |
| Immigrants | Western Asia | 0.4 /100 | #267 | Tragic 73.5% |
| South Americans | 0.4 /100 | #268 | Tragic 73.5% |
| Colombians | 0.3 /100 | #269 | Tragic 73.5% |
| Immigrants | Russia | 0.3 /100 | #270 | Tragic 73.5% |
| Immigrants | Indonesia | 0.3 /100 | #271 | Tragic 73.4% |
| Belizeans | 0.3 /100 | #272 | Tragic 73.4% |
| Cheyenne | 0.2 /100 | #273 | Tragic 73.4% |
| Immigrants | Colombia | 0.2 /100 | #274 | Tragic 73.4% |