Immigrants from Sri Lanka vs Puget Sound Salish In Labor Force | Age 20-24
COMPARE
Immigrants from Sri Lanka
Puget Sound Salish
In Labor Force | Age 20-24
In Labor Force | Age 20-24 Comparison
Immigrants from Sri Lanka
Puget Sound Salish
74.0%
IN LABOR FORCE | AGE 20-24
2.3/ 100
METRIC RATING
240th/ 347
METRIC RANK
78.0%
IN LABOR FORCE | AGE 20-24
100.0/ 100
METRIC RATING
21st/ 347
METRIC RANK
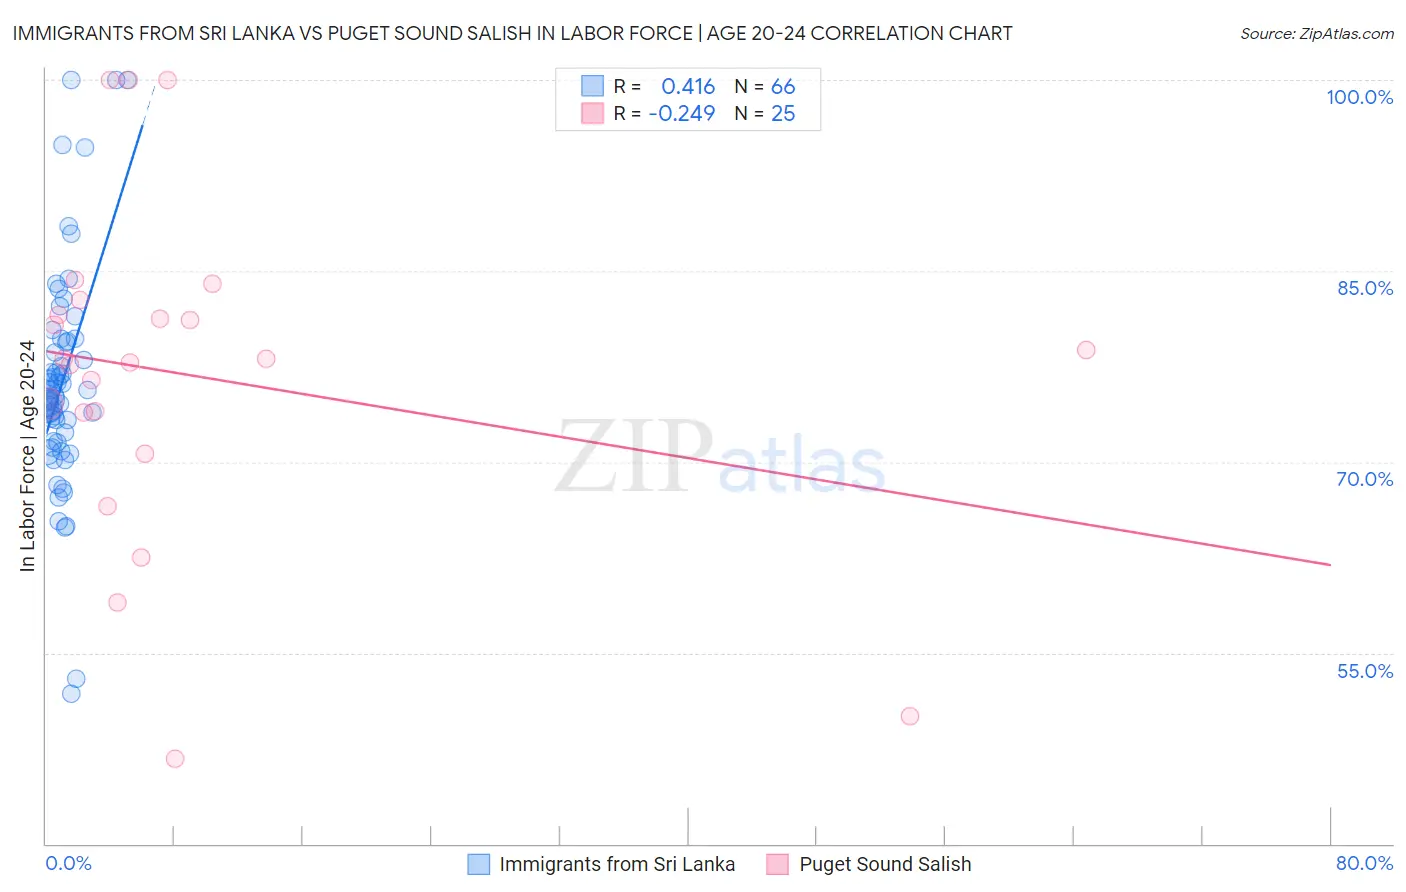
Immigrants from Sri Lanka vs Puget Sound Salish In Labor Force | Age 20-24 Correlation Chart
The statistical analysis conducted on geographies consisting of 149,693,440 people shows a moderate positive correlation between the proportion of Immigrants from Sri Lanka and labor force participation rate among population between the ages 20 and 24 in the United States with a correlation coefficient (R) of 0.416 and weighted average of 74.0%. Similarly, the statistical analysis conducted on geographies consisting of 46,155,398 people shows a weak negative correlation between the proportion of Puget Sound Salish and labor force participation rate among population between the ages 20 and 24 in the United States with a correlation coefficient (R) of -0.249 and weighted average of 78.0%, a difference of 5.4%.
In Labor Force | Age 20-24 Correlation Summary
| Measurement | Immigrants from Sri Lanka | Puget Sound Salish |
| Minimum | 51.8% | 46.7% |
| Maximum | 100.0% | 100.0% |
| Range | 48.2% | 53.3% |
| Mean | 76.3% | 76.8% |
| Median | 75.1% | 78.1% |
| Interquartile 25% (IQ1) | 71.6% | 72.2% |
| Interquartile 75% (IQ3) | 79.5% | 82.1% |
| Interquartile Range (IQR) | 7.8% | 9.9% |
| Standard Deviation (Sample) | 8.9% | 13.2% |
| Standard Deviation (Population) | 8.8% | 12.9% |
Similar Demographics by In Labor Force | Age 20-24
Demographics Similar to Immigrants from Sri Lanka by In Labor Force | Age 20-24
In terms of in labor force | age 20-24, the demographic groups most similar to Immigrants from Sri Lanka are Immigrants from Senegal (74.0%, a difference of 0.030%), Thai (74.0%, a difference of 0.040%), Immigrants from Latin America (74.1%, a difference of 0.060%), Immigrants from Syria (74.0%, a difference of 0.070%), and Immigrants from South Central Asia (74.0%, a difference of 0.070%).
| Demographics | Rating | Rank | In Labor Force | Age 20-24 |
| Immigrants | Chile | 3.7 /100 | #233 | Tragic 74.1% |
| Immigrants | Immigrants | 3.6 /100 | #234 | Tragic 74.1% |
| Laotians | 3.5 /100 | #235 | Tragic 74.1% |
| Immigrants | France | 3.3 /100 | #236 | Tragic 74.1% |
| Bermudans | 3.2 /100 | #237 | Tragic 74.1% |
| Immigrants | Japan | 3.0 /100 | #238 | Tragic 74.1% |
| Immigrants | Latin America | 2.7 /100 | #239 | Tragic 74.1% |
| Immigrants | Sri Lanka | 2.3 /100 | #240 | Tragic 74.0% |
| Immigrants | Senegal | 2.1 /100 | #241 | Tragic 74.0% |
| Thais | 2.1 /100 | #242 | Tragic 74.0% |
| Immigrants | Syria | 1.9 /100 | #243 | Tragic 74.0% |
| Immigrants | South Central Asia | 1.9 /100 | #244 | Tragic 74.0% |
| Turks | 1.8 /100 | #245 | Tragic 73.9% |
| Immigrants | Panama | 1.6 /100 | #246 | Tragic 73.9% |
| Colville | 1.5 /100 | #247 | Tragic 73.9% |
Demographics Similar to Puget Sound Salish by In Labor Force | Age 20-24
In terms of in labor force | age 20-24, the demographic groups most similar to Puget Sound Salish are Pennsylvania German (78.0%, a difference of 0.060%), French Canadian (78.1%, a difference of 0.070%), Yugoslavian (78.0%, a difference of 0.070%), Liberian (78.0%, a difference of 0.070%), and Tlingit-Haida (77.9%, a difference of 0.11%).
| Demographics | Rating | Rank | In Labor Force | Age 20-24 |
| Czechs | 100.0 /100 | #14 | Exceptional 78.5% |
| Sudanese | 100.0 /100 | #15 | Exceptional 78.4% |
| Dutch | 100.0 /100 | #16 | Exceptional 78.4% |
| Cape Verdeans | 100.0 /100 | #17 | Exceptional 78.3% |
| Immigrants | Bosnia and Herzegovina | 100.0 /100 | #18 | Exceptional 78.1% |
| Bangladeshis | 100.0 /100 | #19 | Exceptional 78.1% |
| French Canadians | 100.0 /100 | #20 | Exceptional 78.1% |
| Puget Sound Salish | 100.0 /100 | #21 | Exceptional 78.0% |
| Pennsylvania Germans | 100.0 /100 | #22 | Exceptional 78.0% |
| Yugoslavians | 100.0 /100 | #23 | Exceptional 78.0% |
| Liberians | 100.0 /100 | #24 | Exceptional 78.0% |
| Tlingit-Haida | 100.0 /100 | #25 | Exceptional 77.9% |
| Tongans | 100.0 /100 | #26 | Exceptional 77.9% |
| Immigrants | Micronesia | 100.0 /100 | #27 | Exceptional 77.8% |
| Belgians | 100.0 /100 | #28 | Exceptional 77.8% |