Apache vs Puget Sound Salish In Labor Force | Age 20-24
COMPARE
Apache
Puget Sound Salish
In Labor Force | Age 20-24
In Labor Force | Age 20-24 Comparison
Apache
Puget Sound Salish
72.0%
IN LABOR FORCE | AGE 20-24
0.0/ 100
METRIC RATING
311th/ 347
METRIC RANK
78.0%
IN LABOR FORCE | AGE 20-24
100.0/ 100
METRIC RATING
21st/ 347
METRIC RANK
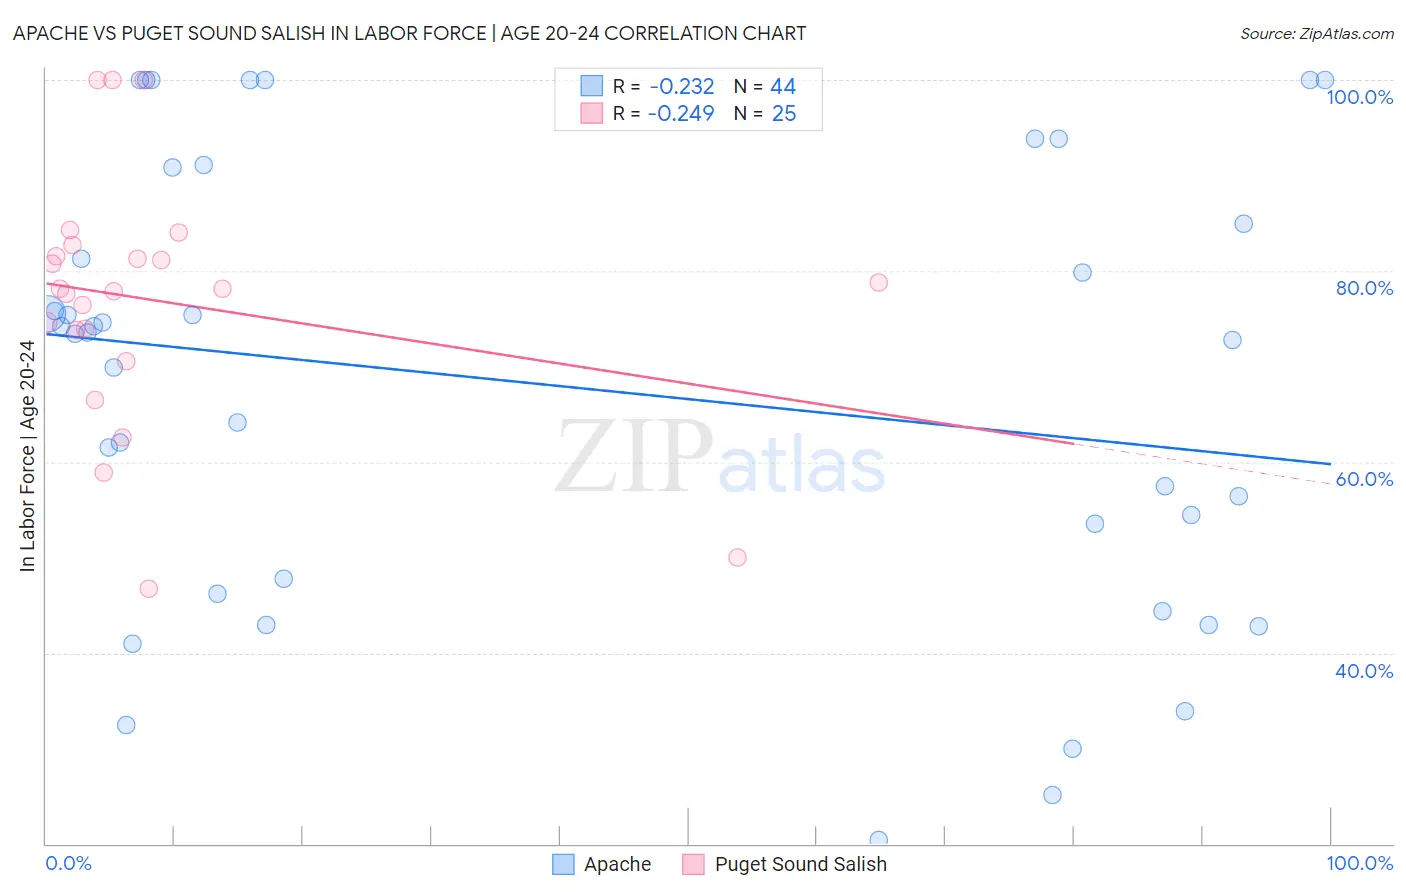
Apache vs Puget Sound Salish In Labor Force | Age 20-24 Correlation Chart
The statistical analysis conducted on geographies consisting of 231,058,831 people shows a weak negative correlation between the proportion of Apache and labor force participation rate among population between the ages 20 and 24 in the United States with a correlation coefficient (R) of -0.232 and weighted average of 72.0%. Similarly, the statistical analysis conducted on geographies consisting of 46,155,398 people shows a weak negative correlation between the proportion of Puget Sound Salish and labor force participation rate among population between the ages 20 and 24 in the United States with a correlation coefficient (R) of -0.249 and weighted average of 78.0%, a difference of 8.4%.
In Labor Force | Age 20-24 Correlation Summary
| Measurement | Apache | Puget Sound Salish |
| Minimum | 20.4% | 46.7% |
| Maximum | 100.0% | 100.0% |
| Range | 79.6% | 53.3% |
| Mean | 67.9% | 76.8% |
| Median | 73.5% | 78.1% |
| Interquartile 25% (IQ1) | 47.0% | 72.2% |
| Interquartile 75% (IQ3) | 87.9% | 82.1% |
| Interquartile Range (IQR) | 40.9% | 9.9% |
| Standard Deviation (Sample) | 23.3% | 13.2% |
| Standard Deviation (Population) | 23.1% | 12.9% |
Similar Demographics by In Labor Force | Age 20-24
Demographics Similar to Apache by In Labor Force | Age 20-24
In terms of in labor force | age 20-24, the demographic groups most similar to Apache are Immigrants from Cuba (72.0%, a difference of 0.010%), Immigrants from Caribbean (71.9%, a difference of 0.070%), Immigrants from Dominica (71.9%, a difference of 0.12%), Indian (Asian) (71.9%, a difference of 0.13%), and Immigrants from Iran (71.8%, a difference of 0.22%).
| Demographics | Rating | Rank | In Labor Force | Age 20-24 |
| Immigrants | West Indies | 0.0 /100 | #304 | Tragic 72.4% |
| Immigrants | Singapore | 0.0 /100 | #305 | Tragic 72.4% |
| Immigrants | Jamaica | 0.0 /100 | #306 | Tragic 72.4% |
| Immigrants | Ecuador | 0.0 /100 | #307 | Tragic 72.3% |
| Soviet Union | 0.0 /100 | #308 | Tragic 72.3% |
| Tsimshian | 0.0 /100 | #309 | Tragic 72.3% |
| Immigrants | Cuba | 0.0 /100 | #310 | Tragic 72.0% |
| Apache | 0.0 /100 | #311 | Tragic 72.0% |
| Immigrants | Caribbean | 0.0 /100 | #312 | Tragic 71.9% |
| Immigrants | Dominica | 0.0 /100 | #313 | Tragic 71.9% |
| Indians (Asian) | 0.0 /100 | #314 | Tragic 71.9% |
| Immigrants | Iran | 0.0 /100 | #315 | Tragic 71.8% |
| Immigrants | Eastern Asia | 0.0 /100 | #316 | Tragic 71.8% |
| Immigrants | Armenia | 0.0 /100 | #317 | Tragic 71.7% |
| Immigrants | Hong Kong | 0.0 /100 | #318 | Tragic 71.6% |
Demographics Similar to Puget Sound Salish by In Labor Force | Age 20-24
In terms of in labor force | age 20-24, the demographic groups most similar to Puget Sound Salish are Pennsylvania German (78.0%, a difference of 0.060%), French Canadian (78.1%, a difference of 0.070%), Yugoslavian (78.0%, a difference of 0.070%), Liberian (78.0%, a difference of 0.070%), and Tlingit-Haida (77.9%, a difference of 0.11%).
| Demographics | Rating | Rank | In Labor Force | Age 20-24 |
| Czechs | 100.0 /100 | #14 | Exceptional 78.5% |
| Sudanese | 100.0 /100 | #15 | Exceptional 78.4% |
| Dutch | 100.0 /100 | #16 | Exceptional 78.4% |
| Cape Verdeans | 100.0 /100 | #17 | Exceptional 78.3% |
| Immigrants | Bosnia and Herzegovina | 100.0 /100 | #18 | Exceptional 78.1% |
| Bangladeshis | 100.0 /100 | #19 | Exceptional 78.1% |
| French Canadians | 100.0 /100 | #20 | Exceptional 78.1% |
| Puget Sound Salish | 100.0 /100 | #21 | Exceptional 78.0% |
| Pennsylvania Germans | 100.0 /100 | #22 | Exceptional 78.0% |
| Yugoslavians | 100.0 /100 | #23 | Exceptional 78.0% |
| Liberians | 100.0 /100 | #24 | Exceptional 78.0% |
| Tlingit-Haida | 100.0 /100 | #25 | Exceptional 77.9% |
| Tongans | 100.0 /100 | #26 | Exceptional 77.9% |
| Immigrants | Micronesia | 100.0 /100 | #27 | Exceptional 77.8% |
| Belgians | 100.0 /100 | #28 | Exceptional 77.8% |