Yup'ik vs Immigrants from West Indies In Labor Force | Age 20-24
COMPARE
Yup'ik
Immigrants from West Indies
In Labor Force | Age 20-24
In Labor Force | Age 20-24 Comparison
Yup'ik
Immigrants from West Indies
70.9%
IN LABOR FORCE | AGE 20-24
0.0/ 100
METRIC RATING
329th/ 347
METRIC RANK
72.4%
IN LABOR FORCE | AGE 20-24
0.0/ 100
METRIC RATING
304th/ 347
METRIC RANK
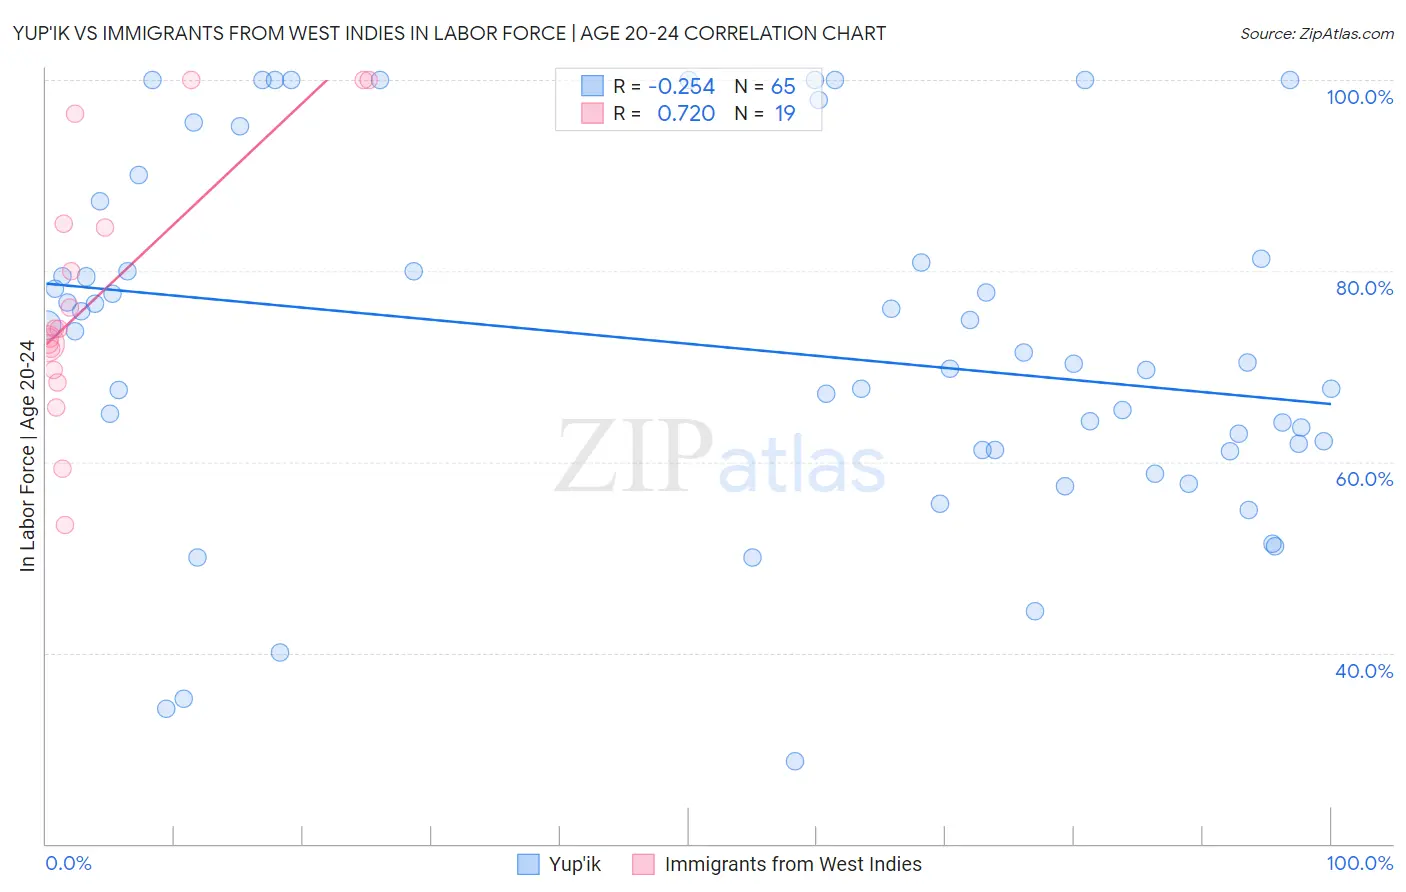
Yup'ik vs Immigrants from West Indies In Labor Force | Age 20-24 Correlation Chart
The statistical analysis conducted on geographies consisting of 39,958,192 people shows a weak negative correlation between the proportion of Yup'ik and labor force participation rate among population between the ages 20 and 24 in the United States with a correlation coefficient (R) of -0.254 and weighted average of 70.9%. Similarly, the statistical analysis conducted on geographies consisting of 72,452,625 people shows a strong positive correlation between the proportion of Immigrants from West Indies and labor force participation rate among population between the ages 20 and 24 in the United States with a correlation coefficient (R) of 0.720 and weighted average of 72.4%, a difference of 2.1%.
In Labor Force | Age 20-24 Correlation Summary
| Measurement | Yup'ik | Immigrants from West Indies |
| Minimum | 28.6% | 53.4% |
| Maximum | 100.0% | 100.0% |
| Range | 71.4% | 46.6% |
| Mean | 72.2% | 77.7% |
| Median | 70.4% | 73.9% |
| Interquartile 25% (IQ1) | 61.3% | 69.6% |
| Interquartile 75% (IQ3) | 81.1% | 85.0% |
| Interquartile Range (IQR) | 19.8% | 15.4% |
| Standard Deviation (Sample) | 18.2% | 13.6% |
| Standard Deviation (Population) | 18.1% | 13.2% |
Similar Demographics by In Labor Force | Age 20-24
Demographics Similar to Yup'ik by In Labor Force | Age 20-24
In terms of in labor force | age 20-24, the demographic groups most similar to Yup'ik are Immigrants from China (71.1%, a difference of 0.24%), Dominican (71.1%, a difference of 0.26%), Immigrants from Trinidad and Tobago (71.1%, a difference of 0.26%), Barbadian (71.1%, a difference of 0.35%), and Vietnamese (70.6%, a difference of 0.35%).
| Demographics | Rating | Rank | In Labor Force | Age 20-24 |
| Filipinos | 0.0 /100 | #322 | Tragic 71.4% |
| West Indians | 0.0 /100 | #323 | Tragic 71.3% |
| Immigrants | Dominican Republic | 0.0 /100 | #324 | Tragic 71.2% |
| Barbadians | 0.0 /100 | #325 | Tragic 71.1% |
| Dominicans | 0.0 /100 | #326 | Tragic 71.1% |
| Immigrants | Trinidad and Tobago | 0.0 /100 | #327 | Tragic 71.1% |
| Immigrants | China | 0.0 /100 | #328 | Tragic 71.1% |
| Yup'ik | 0.0 /100 | #329 | Tragic 70.9% |
| Vietnamese | 0.0 /100 | #330 | Tragic 70.6% |
| Immigrants | Bangladesh | 0.0 /100 | #331 | Tragic 70.6% |
| Immigrants | Uzbekistan | 0.0 /100 | #332 | Tragic 70.4% |
| Yuman | 0.0 /100 | #333 | Tragic 70.3% |
| British West Indians | 0.0 /100 | #334 | Tragic 70.0% |
| Immigrants | Barbados | 0.0 /100 | #335 | Tragic 69.7% |
| Immigrants | Guyana | 0.0 /100 | #336 | Tragic 69.3% |
Demographics Similar to Immigrants from West Indies by In Labor Force | Age 20-24
In terms of in labor force | age 20-24, the demographic groups most similar to Immigrants from West Indies are Ecuadorian (72.4%, a difference of 0.010%), Native/Alaskan (72.4%, a difference of 0.020%), Immigrants from Singapore (72.4%, a difference of 0.030%), Immigrants from Jamaica (72.4%, a difference of 0.050%), and Cuban (72.5%, a difference of 0.11%).
| Demographics | Rating | Rank | In Labor Force | Age 20-24 |
| Central American Indians | 0.0 /100 | #297 | Tragic 72.7% |
| Israelis | 0.0 /100 | #298 | Tragic 72.6% |
| Iranians | 0.0 /100 | #299 | Tragic 72.6% |
| Armenians | 0.0 /100 | #300 | Tragic 72.5% |
| Cubans | 0.0 /100 | #301 | Tragic 72.5% |
| Natives/Alaskans | 0.0 /100 | #302 | Tragic 72.4% |
| Ecuadorians | 0.0 /100 | #303 | Tragic 72.4% |
| Immigrants | West Indies | 0.0 /100 | #304 | Tragic 72.4% |
| Immigrants | Singapore | 0.0 /100 | #305 | Tragic 72.4% |
| Immigrants | Jamaica | 0.0 /100 | #306 | Tragic 72.4% |
| Immigrants | Ecuador | 0.0 /100 | #307 | Tragic 72.3% |
| Soviet Union | 0.0 /100 | #308 | Tragic 72.3% |
| Tsimshian | 0.0 /100 | #309 | Tragic 72.3% |
| Immigrants | Cuba | 0.0 /100 | #310 | Tragic 72.0% |
| Apache | 0.0 /100 | #311 | Tragic 72.0% |