Yup'ik vs Immigrants from Burma/Myanmar In Labor Force | Age 20-24
COMPARE
Yup'ik
Immigrants from Burma/Myanmar
In Labor Force | Age 20-24
In Labor Force | Age 20-24 Comparison
Yup'ik
Immigrants from Burma/Myanmar
70.9%
IN LABOR FORCE | AGE 20-24
0.0/ 100
METRIC RATING
329th/ 347
METRIC RANK
76.3%
IN LABOR FORCE | AGE 20-24
99.1/ 100
METRIC RATING
90th/ 347
METRIC RANK
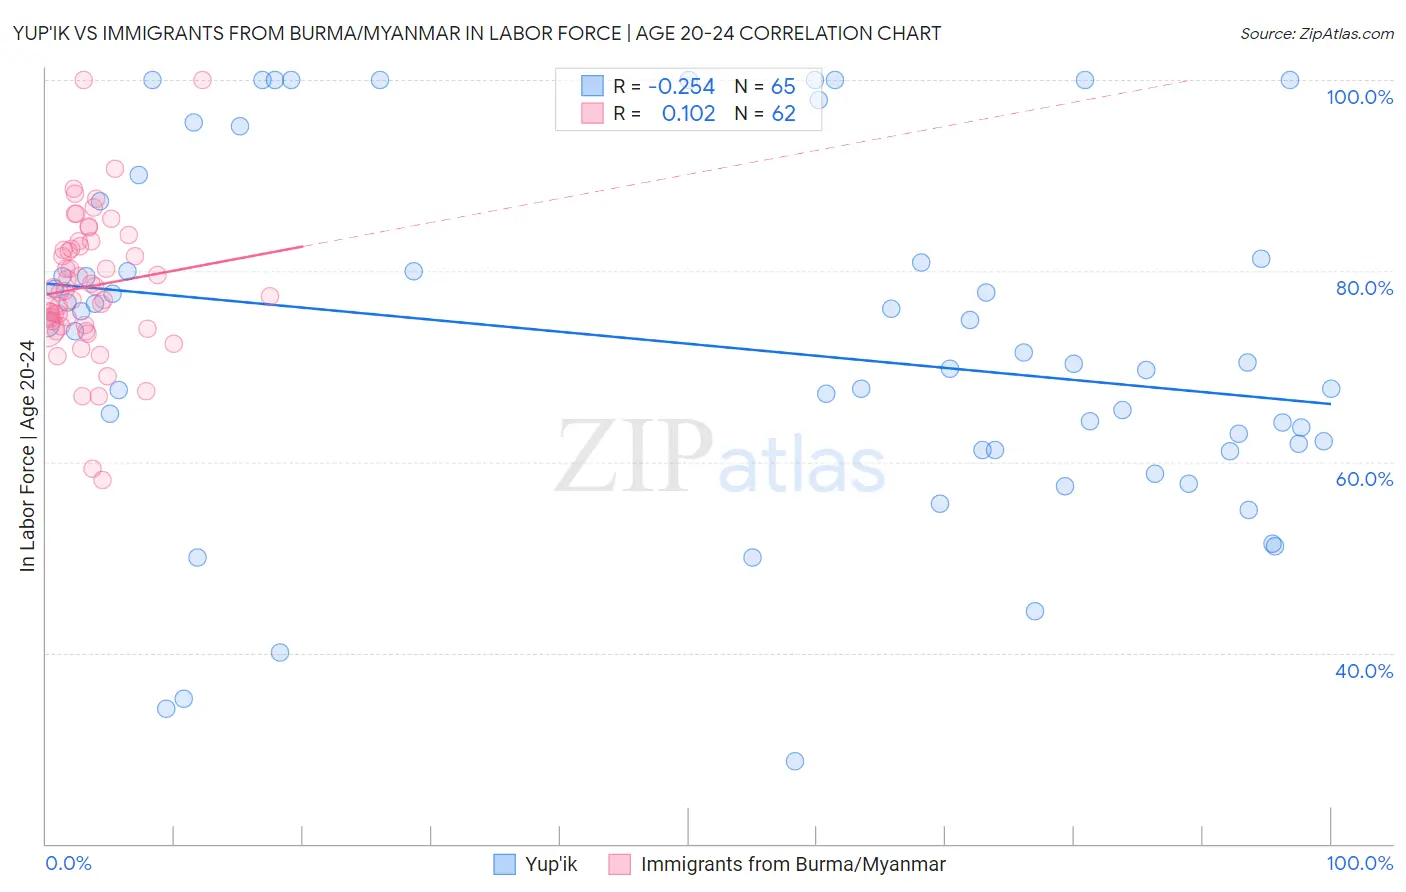
Yup'ik vs Immigrants from Burma/Myanmar In Labor Force | Age 20-24 Correlation Chart
The statistical analysis conducted on geographies consisting of 39,958,192 people shows a weak negative correlation between the proportion of Yup'ik and labor force participation rate among population between the ages 20 and 24 in the United States with a correlation coefficient (R) of -0.254 and weighted average of 70.9%. Similarly, the statistical analysis conducted on geographies consisting of 172,353,766 people shows a poor positive correlation between the proportion of Immigrants from Burma/Myanmar and labor force participation rate among population between the ages 20 and 24 in the United States with a correlation coefficient (R) of 0.102 and weighted average of 76.3%, a difference of 7.7%.
In Labor Force | Age 20-24 Correlation Summary
| Measurement | Yup'ik | Immigrants from Burma/Myanmar |
| Minimum | 28.6% | 58.1% |
| Maximum | 100.0% | 100.0% |
| Range | 71.4% | 41.9% |
| Mean | 72.2% | 78.4% |
| Median | 70.4% | 77.8% |
| Interquartile 25% (IQ1) | 61.3% | 74.3% |
| Interquartile 75% (IQ3) | 81.1% | 82.6% |
| Interquartile Range (IQR) | 19.8% | 8.3% |
| Standard Deviation (Sample) | 18.2% | 7.6% |
| Standard Deviation (Population) | 18.1% | 7.5% |
Similar Demographics by In Labor Force | Age 20-24
Demographics Similar to Yup'ik by In Labor Force | Age 20-24
In terms of in labor force | age 20-24, the demographic groups most similar to Yup'ik are Immigrants from China (71.1%, a difference of 0.24%), Dominican (71.1%, a difference of 0.26%), Immigrants from Trinidad and Tobago (71.1%, a difference of 0.26%), Barbadian (71.1%, a difference of 0.35%), and Vietnamese (70.6%, a difference of 0.35%).
| Demographics | Rating | Rank | In Labor Force | Age 20-24 |
| Filipinos | 0.0 /100 | #322 | Tragic 71.4% |
| West Indians | 0.0 /100 | #323 | Tragic 71.3% |
| Immigrants | Dominican Republic | 0.0 /100 | #324 | Tragic 71.2% |
| Barbadians | 0.0 /100 | #325 | Tragic 71.1% |
| Dominicans | 0.0 /100 | #326 | Tragic 71.1% |
| Immigrants | Trinidad and Tobago | 0.0 /100 | #327 | Tragic 71.1% |
| Immigrants | China | 0.0 /100 | #328 | Tragic 71.1% |
| Yup'ik | 0.0 /100 | #329 | Tragic 70.9% |
| Vietnamese | 0.0 /100 | #330 | Tragic 70.6% |
| Immigrants | Bangladesh | 0.0 /100 | #331 | Tragic 70.6% |
| Immigrants | Uzbekistan | 0.0 /100 | #332 | Tragic 70.4% |
| Yuman | 0.0 /100 | #333 | Tragic 70.3% |
| British West Indians | 0.0 /100 | #334 | Tragic 70.0% |
| Immigrants | Barbados | 0.0 /100 | #335 | Tragic 69.7% |
| Immigrants | Guyana | 0.0 /100 | #336 | Tragic 69.3% |
Demographics Similar to Immigrants from Burma/Myanmar by In Labor Force | Age 20-24
In terms of in labor force | age 20-24, the demographic groups most similar to Immigrants from Burma/Myanmar are Sierra Leonean (76.3%, a difference of 0.020%), Spanish (76.4%, a difference of 0.050%), Bulgarian (76.4%, a difference of 0.050%), Maltese (76.3%, a difference of 0.050%), and Hungarian (76.3%, a difference of 0.070%).
| Demographics | Rating | Rank | In Labor Force | Age 20-24 |
| Carpatho Rusyns | 99.4 /100 | #83 | Exceptional 76.5% |
| Austrians | 99.4 /100 | #84 | Exceptional 76.5% |
| Portuguese | 99.3 /100 | #85 | Exceptional 76.4% |
| Immigrants | Iraq | 99.3 /100 | #86 | Exceptional 76.4% |
| Immigrants | Thailand | 99.3 /100 | #87 | Exceptional 76.4% |
| Spanish | 99.2 /100 | #88 | Exceptional 76.4% |
| Bulgarians | 99.2 /100 | #89 | Exceptional 76.4% |
| Immigrants | Burma/Myanmar | 99.1 /100 | #90 | Exceptional 76.3% |
| Sierra Leoneans | 99.0 /100 | #91 | Exceptional 76.3% |
| Maltese | 98.9 /100 | #92 | Exceptional 76.3% |
| Hungarians | 98.9 /100 | #93 | Exceptional 76.3% |
| Potawatomi | 98.5 /100 | #94 | Exceptional 76.2% |
| Immigrants | Germany | 98.5 /100 | #95 | Exceptional 76.2% |
| Immigrants | Nonimmigrants | 98.5 /100 | #96 | Exceptional 76.2% |
| Immigrants | Lithuania | 98.0 /100 | #97 | Exceptional 76.1% |