Marshallese vs Puget Sound Salish In Labor Force | Age 20-24
COMPARE
Marshallese
Puget Sound Salish
In Labor Force | Age 20-24
In Labor Force | Age 20-24 Comparison
Marshallese
Puget Sound Salish
77.4%
IN LABOR FORCE | AGE 20-24
100.0/ 100
METRIC RATING
38th/ 347
METRIC RANK
78.0%
IN LABOR FORCE | AGE 20-24
100.0/ 100
METRIC RATING
21st/ 347
METRIC RANK
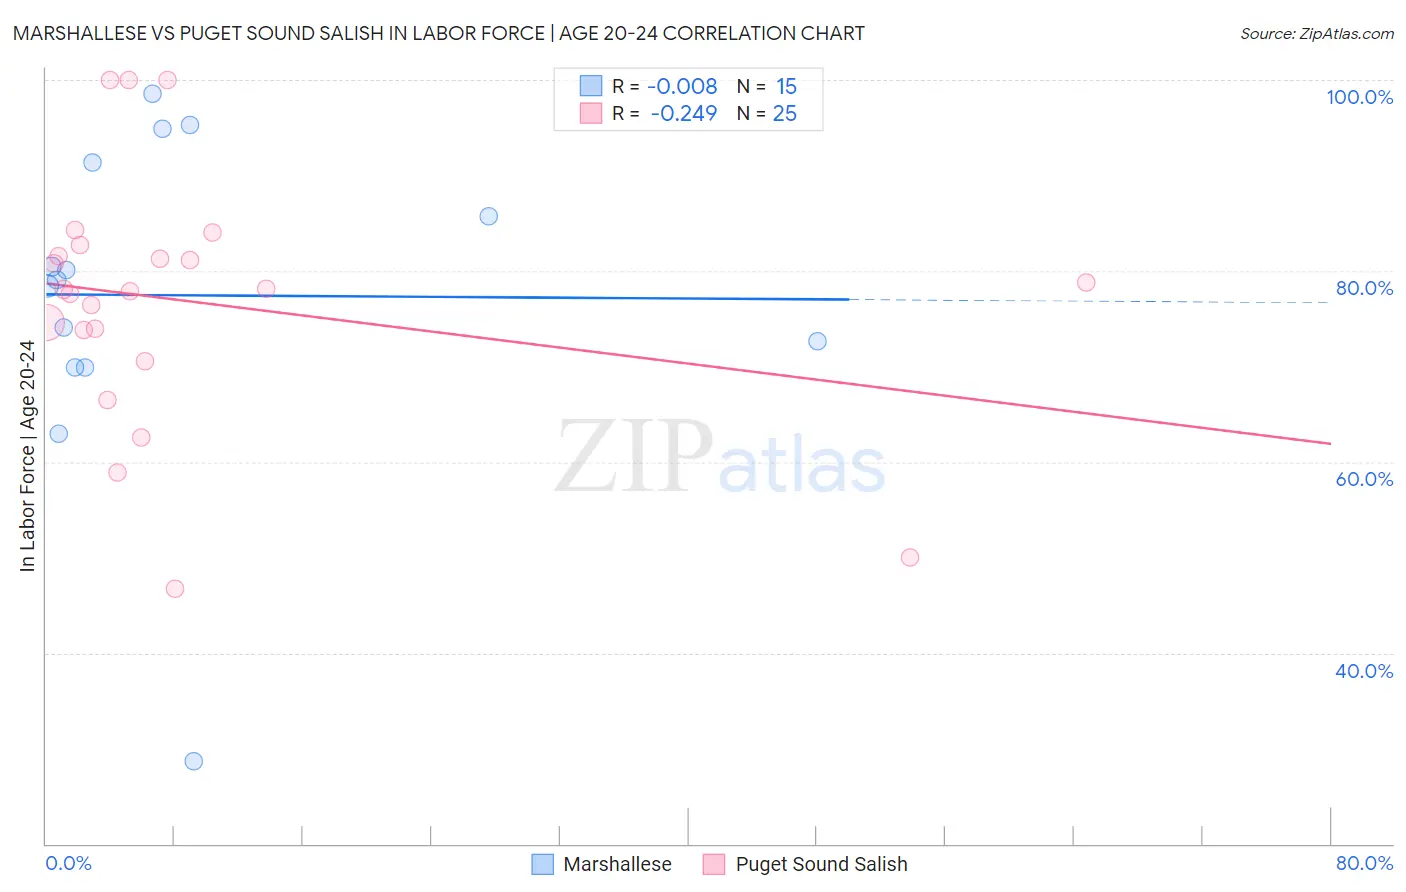
Marshallese vs Puget Sound Salish In Labor Force | Age 20-24 Correlation Chart
The statistical analysis conducted on geographies consisting of 14,760,991 people shows no correlation between the proportion of Marshallese and labor force participation rate among population between the ages 20 and 24 in the United States with a correlation coefficient (R) of -0.008 and weighted average of 77.4%. Similarly, the statistical analysis conducted on geographies consisting of 46,155,398 people shows a weak negative correlation between the proportion of Puget Sound Salish and labor force participation rate among population between the ages 20 and 24 in the United States with a correlation coefficient (R) of -0.249 and weighted average of 78.0%, a difference of 0.73%.
In Labor Force | Age 20-24 Correlation Summary
| Measurement | Marshallese | Puget Sound Salish |
| Minimum | 28.6% | 46.7% |
| Maximum | 98.5% | 100.0% |
| Range | 69.9% | 53.3% |
| Mean | 77.5% | 76.8% |
| Median | 79.1% | 78.1% |
| Interquartile 25% (IQ1) | 69.9% | 72.2% |
| Interquartile 75% (IQ3) | 91.3% | 82.1% |
| Interquartile Range (IQR) | 21.4% | 9.9% |
| Standard Deviation (Sample) | 17.1% | 13.2% |
| Standard Deviation (Population) | 16.5% | 12.9% |
Demographics Similar to Marshallese and Puget Sound Salish by In Labor Force | Age 20-24
In terms of in labor force | age 20-24, the demographic groups most similar to Marshallese are Irish (77.4%, a difference of 0.030%), Czechoslovakian (77.5%, a difference of 0.050%), Welsh (77.5%, a difference of 0.070%), Immigrants from Eastern Africa (77.5%, a difference of 0.090%), and German Russian (77.5%, a difference of 0.10%). Similarly, the demographic groups most similar to Puget Sound Salish are Pennsylvania German (78.0%, a difference of 0.060%), French Canadian (78.1%, a difference of 0.070%), Yugoslavian (78.0%, a difference of 0.070%), Liberian (78.0%, a difference of 0.070%), and Tlingit-Haida (77.9%, a difference of 0.11%).
| Demographics | Rating | Rank | In Labor Force | Age 20-24 |
| Bangladeshis | 100.0 /100 | #19 | Exceptional 78.1% |
| French Canadians | 100.0 /100 | #20 | Exceptional 78.1% |
| Puget Sound Salish | 100.0 /100 | #21 | Exceptional 78.0% |
| Pennsylvania Germans | 100.0 /100 | #22 | Exceptional 78.0% |
| Yugoslavians | 100.0 /100 | #23 | Exceptional 78.0% |
| Liberians | 100.0 /100 | #24 | Exceptional 78.0% |
| Tlingit-Haida | 100.0 /100 | #25 | Exceptional 77.9% |
| Tongans | 100.0 /100 | #26 | Exceptional 77.9% |
| Immigrants | Micronesia | 100.0 /100 | #27 | Exceptional 77.8% |
| Belgians | 100.0 /100 | #28 | Exceptional 77.8% |
| Slovaks | 100.0 /100 | #29 | Exceptional 77.7% |
| Swiss | 100.0 /100 | #30 | Exceptional 77.7% |
| Poles | 100.0 /100 | #31 | Exceptional 77.6% |
| English | 100.0 /100 | #32 | Exceptional 77.6% |
| Immigrants | Ethiopia | 100.0 /100 | #33 | Exceptional 77.5% |
| German Russians | 100.0 /100 | #34 | Exceptional 77.5% |
| Immigrants | Eastern Africa | 100.0 /100 | #35 | Exceptional 77.5% |
| Welsh | 100.0 /100 | #36 | Exceptional 77.5% |
| Czechoslovakians | 100.0 /100 | #37 | Exceptional 77.5% |
| Marshallese | 100.0 /100 | #38 | Exceptional 77.4% |
| Irish | 100.0 /100 | #39 | Exceptional 77.4% |