Moroccan vs Iroquois In Labor Force | Age 16-19
COMPARE
Moroccan
Iroquois
In Labor Force | Age 16-19
In Labor Force | Age 16-19 Comparison
Moroccans
Iroquois
35.7%
IN LABOR FORCE | AGE 16-19
12.7/ 100
METRIC RATING
209th/ 347
METRIC RANK
39.9%
IN LABOR FORCE | AGE 16-19
99.9/ 100
METRIC RATING
72nd/ 347
METRIC RANK
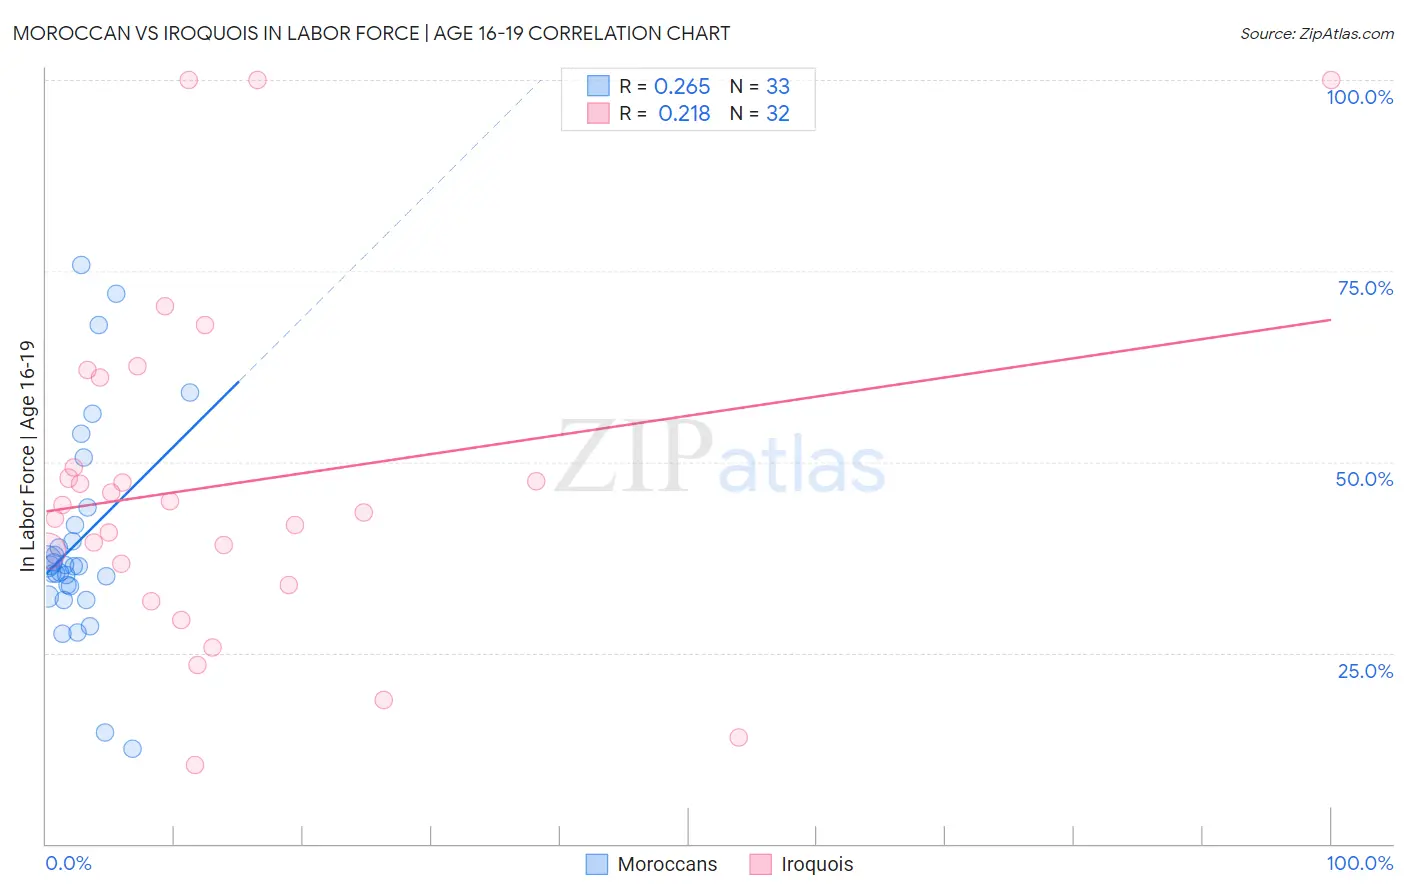
Moroccan vs Iroquois In Labor Force | Age 16-19 Correlation Chart
The statistical analysis conducted on geographies consisting of 201,678,559 people shows a weak positive correlation between the proportion of Moroccans and labor force participation rate among population between the ages 16 and 19 in the United States with a correlation coefficient (R) of 0.265 and weighted average of 35.7%. Similarly, the statistical analysis conducted on geographies consisting of 207,097,008 people shows a weak positive correlation between the proportion of Iroquois and labor force participation rate among population between the ages 16 and 19 in the United States with a correlation coefficient (R) of 0.218 and weighted average of 39.9%, a difference of 11.9%.
In Labor Force | Age 16-19 Correlation Summary
| Measurement | Moroccan | Iroquois |
| Minimum | 12.5% | 10.4% |
| Maximum | 75.8% | 100.0% |
| Range | 63.3% | 89.6% |
| Mean | 39.6% | 47.1% |
| Median | 36.4% | 43.8% |
| Interquartile 25% (IQ1) | 33.0% | 35.2% |
| Interquartile 75% (IQ3) | 42.9% | 55.2% |
| Interquartile Range (IQR) | 9.9% | 19.9% |
| Standard Deviation (Sample) | 14.1% | 22.3% |
| Standard Deviation (Population) | 13.8% | 22.0% |
Similar Demographics by In Labor Force | Age 16-19
Demographics Similar to Moroccans by In Labor Force | Age 16-19
In terms of in labor force | age 16-19, the demographic groups most similar to Moroccans are Korean (35.7%, a difference of 0.070%), Immigrants from Switzerland (35.6%, a difference of 0.10%), Mexican (35.6%, a difference of 0.10%), Immigrants from Eastern Europe (35.8%, a difference of 0.19%), and South American Indian (35.8%, a difference of 0.21%).
| Demographics | Rating | Rank | In Labor Force | Age 16-19 |
| Senegalese | 17.4 /100 | #202 | Poor 35.9% |
| Immigrants | Nigeria | 16.8 /100 | #203 | Poor 35.8% |
| Immigrants | Albania | 15.0 /100 | #204 | Poor 35.8% |
| South American Indians | 14.6 /100 | #205 | Poor 35.8% |
| Chileans | 14.6 /100 | #206 | Poor 35.8% |
| Immigrants | Eastern Europe | 14.5 /100 | #207 | Poor 35.8% |
| Koreans | 13.3 /100 | #208 | Poor 35.7% |
| Moroccans | 12.7 /100 | #209 | Poor 35.7% |
| Immigrants | Switzerland | 11.9 /100 | #210 | Poor 35.6% |
| Mexicans | 11.9 /100 | #211 | Poor 35.6% |
| Houma | 11.0 /100 | #212 | Poor 35.6% |
| Immigrants | Bolivia | 11.0 /100 | #213 | Poor 35.6% |
| Apache | 11.0 /100 | #214 | Poor 35.6% |
| Immigrants | South Eastern Asia | 10.8 /100 | #215 | Poor 35.6% |
| Dutch West Indians | 10.7 /100 | #216 | Poor 35.6% |
Demographics Similar to Iroquois by In Labor Force | Age 16-19
In terms of in labor force | age 16-19, the demographic groups most similar to Iroquois are Serbian (39.9%, a difference of 0.010%), Immigrants from Middle Africa (39.9%, a difference of 0.030%), Portuguese (40.0%, a difference of 0.17%), Potawatomi (40.0%, a difference of 0.22%), and Hungarian (39.8%, a difference of 0.26%).
| Demographics | Rating | Rank | In Labor Force | Age 16-19 |
| Kenyans | 100.0 /100 | #65 | Exceptional 40.1% |
| Immigrants | Nonimmigrants | 100.0 /100 | #66 | Exceptional 40.1% |
| Canadians | 100.0 /100 | #67 | Exceptional 40.1% |
| Italians | 99.9 /100 | #68 | Exceptional 40.1% |
| Potawatomi | 99.9 /100 | #69 | Exceptional 40.0% |
| Portuguese | 99.9 /100 | #70 | Exceptional 40.0% |
| Serbians | 99.9 /100 | #71 | Exceptional 39.9% |
| Iroquois | 99.9 /100 | #72 | Exceptional 39.9% |
| Immigrants | Middle Africa | 99.9 /100 | #73 | Exceptional 39.9% |
| Hungarians | 99.9 /100 | #74 | Exceptional 39.8% |
| French American Indians | 99.9 /100 | #75 | Exceptional 39.8% |
| Malaysians | 99.9 /100 | #76 | Exceptional 39.7% |
| Immigrants | Portugal | 99.9 /100 | #77 | Exceptional 39.7% |
| Austrians | 99.8 /100 | #78 | Exceptional 39.5% |
| Marshallese | 99.8 /100 | #79 | Exceptional 39.5% |