Yup'ik vs Ottawa In Labor Force | Age 16-19
COMPARE
Yup'ik
Ottawa
In Labor Force | Age 16-19
In Labor Force | Age 16-19 Comparison
Yup'ik
Ottawa
33.3%
IN LABOR FORCE | AGE 16-19
0.1/ 100
METRIC RATING
295th/ 347
METRIC RANK
43.0%
IN LABOR FORCE | AGE 16-19
100.0/ 100
METRIC RATING
21st/ 347
METRIC RANK
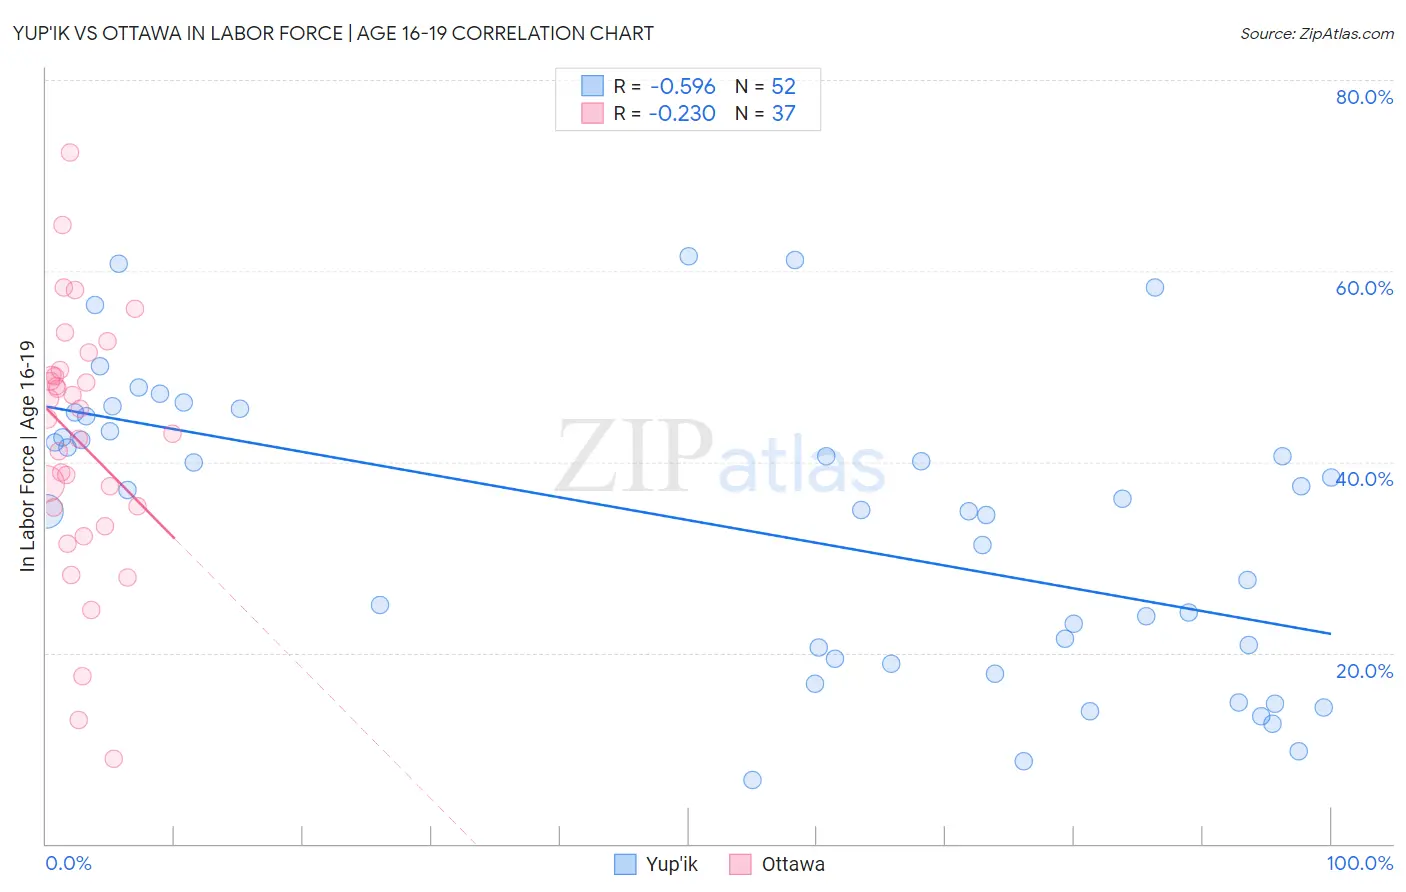
Yup'ik vs Ottawa In Labor Force | Age 16-19 Correlation Chart
The statistical analysis conducted on geographies consisting of 39,923,752 people shows a substantial negative correlation between the proportion of Yup'ik and labor force participation rate among population between the ages 16 and 19 in the United States with a correlation coefficient (R) of -0.596 and weighted average of 33.3%. Similarly, the statistical analysis conducted on geographies consisting of 49,923,011 people shows a weak negative correlation between the proportion of Ottawa and labor force participation rate among population between the ages 16 and 19 in the United States with a correlation coefficient (R) of -0.230 and weighted average of 43.0%, a difference of 29.4%.
In Labor Force | Age 16-19 Correlation Summary
| Measurement | Yup'ik | Ottawa |
| Minimum | 6.7% | 8.9% |
| Maximum | 61.5% | 72.4% |
| Range | 54.8% | 63.5% |
| Mean | 33.3% | 42.1% |
| Median | 35.5% | 44.5% |
| Interquartile 25% (IQ1) | 19.9% | 34.3% |
| Interquartile 75% (IQ3) | 44.0% | 49.3% |
| Interquartile Range (IQR) | 24.1% | 15.1% |
| Standard Deviation (Sample) | 15.0% | 13.5% |
| Standard Deviation (Population) | 14.9% | 13.3% |
Similar Demographics by In Labor Force | Age 16-19
Demographics Similar to Yup'ik by In Labor Force | Age 16-19
In terms of in labor force | age 16-19, the demographic groups most similar to Yup'ik are Argentinean (33.3%, a difference of 0.10%), Immigrants from South America (33.3%, a difference of 0.12%), Jamaican (33.2%, a difference of 0.13%), Immigrants from Haiti (33.2%, a difference of 0.22%), and Haitian (33.4%, a difference of 0.44%).
| Demographics | Rating | Rank | In Labor Force | Age 16-19 |
| Immigrants | Indonesia | 0.1 /100 | #288 | Tragic 33.5% |
| Immigrants | Singapore | 0.1 /100 | #289 | Tragic 33.5% |
| Immigrants | Colombia | 0.1 /100 | #290 | Tragic 33.5% |
| Immigrants | Belarus | 0.1 /100 | #291 | Tragic 33.4% |
| Haitians | 0.1 /100 | #292 | Tragic 33.4% |
| Immigrants | South America | 0.1 /100 | #293 | Tragic 33.3% |
| Argentineans | 0.1 /100 | #294 | Tragic 33.3% |
| Yup'ik | 0.1 /100 | #295 | Tragic 33.3% |
| Jamaicans | 0.1 /100 | #296 | Tragic 33.2% |
| Immigrants | Haiti | 0.1 /100 | #297 | Tragic 33.2% |
| Iranians | 0.0 /100 | #298 | Tragic 33.0% |
| Armenians | 0.0 /100 | #299 | Tragic 32.9% |
| Immigrants | Argentina | 0.0 /100 | #300 | Tragic 32.9% |
| Okinawans | 0.0 /100 | #301 | Tragic 32.8% |
| Belizeans | 0.0 /100 | #302 | Tragic 32.8% |
Demographics Similar to Ottawa by In Labor Force | Age 16-19
In terms of in labor force | age 16-19, the demographic groups most similar to Ottawa are Sudanese (42.9%, a difference of 0.40%), Swiss (43.3%, a difference of 0.56%), Belgian (43.4%, a difference of 0.78%), Slovak (42.6%, a difference of 0.99%), and French Canadian (43.6%, a difference of 1.3%).
| Demographics | Rating | Rank | In Labor Force | Age 16-19 |
| Chippewa | 100.0 /100 | #14 | Exceptional 43.8% |
| Slovenes | 100.0 /100 | #15 | Exceptional 43.7% |
| Czechs | 100.0 /100 | #16 | Exceptional 43.6% |
| Scandinavians | 100.0 /100 | #17 | Exceptional 43.6% |
| French Canadians | 100.0 /100 | #18 | Exceptional 43.6% |
| Belgians | 100.0 /100 | #19 | Exceptional 43.4% |
| Swiss | 100.0 /100 | #20 | Exceptional 43.3% |
| Ottawa | 100.0 /100 | #21 | Exceptional 43.0% |
| Sudanese | 100.0 /100 | #22 | Exceptional 42.9% |
| Slovaks | 100.0 /100 | #23 | Exceptional 42.6% |
| Bangladeshis | 100.0 /100 | #24 | Exceptional 42.5% |
| German Russians | 100.0 /100 | #25 | Exceptional 42.4% |
| English | 100.0 /100 | #26 | Exceptional 42.4% |
| Welsh | 100.0 /100 | #27 | Exceptional 42.3% |
| Poles | 100.0 /100 | #28 | Exceptional 42.1% |