Yup'ik vs Immigrants from Bulgaria In Labor Force | Age 16-19
COMPARE
Yup'ik
Immigrants from Bulgaria
In Labor Force | Age 16-19
In Labor Force | Age 16-19 Comparison
Yup'ik
Immigrants from Bulgaria
33.3%
IN LABOR FORCE | AGE 16-19
0.1/ 100
METRIC RATING
295th/ 347
METRIC RANK
37.3%
IN LABOR FORCE | AGE 16-19
81.6/ 100
METRIC RATING
154th/ 347
METRIC RANK
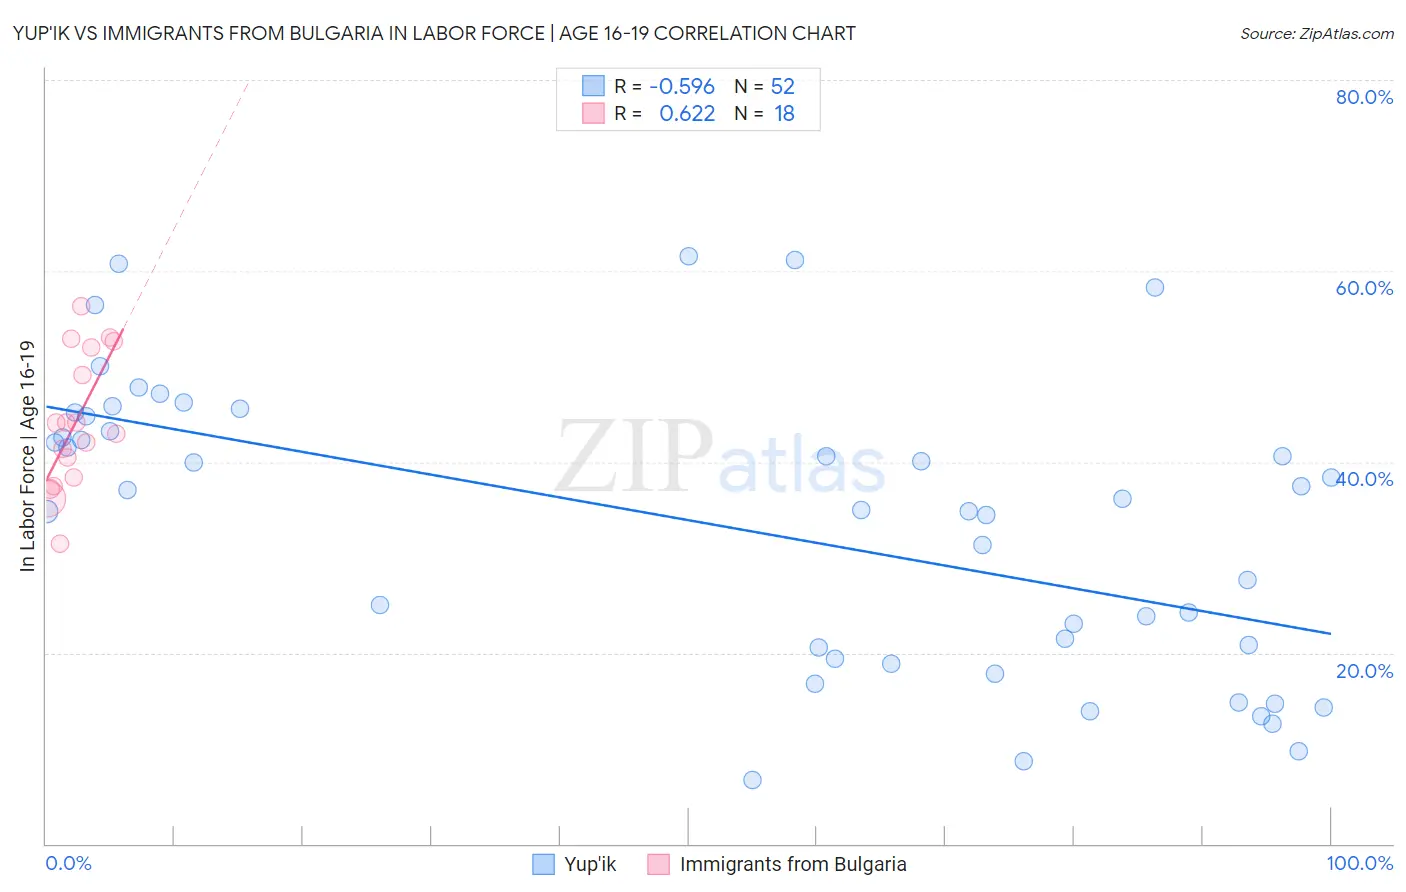
Yup'ik vs Immigrants from Bulgaria In Labor Force | Age 16-19 Correlation Chart
The statistical analysis conducted on geographies consisting of 39,923,752 people shows a substantial negative correlation between the proportion of Yup'ik and labor force participation rate among population between the ages 16 and 19 in the United States with a correlation coefficient (R) of -0.596 and weighted average of 33.3%. Similarly, the statistical analysis conducted on geographies consisting of 172,373,837 people shows a significant positive correlation between the proportion of Immigrants from Bulgaria and labor force participation rate among population between the ages 16 and 19 in the United States with a correlation coefficient (R) of 0.622 and weighted average of 37.3%, a difference of 12.0%.
In Labor Force | Age 16-19 Correlation Summary
| Measurement | Yup'ik | Immigrants from Bulgaria |
| Minimum | 6.7% | 31.4% |
| Maximum | 61.5% | 56.3% |
| Range | 54.8% | 24.8% |
| Mean | 33.3% | 44.2% |
| Median | 35.5% | 43.5% |
| Interquartile 25% (IQ1) | 19.9% | 38.4% |
| Interquartile 75% (IQ3) | 44.0% | 52.0% |
| Interquartile Range (IQR) | 24.1% | 13.6% |
| Standard Deviation (Sample) | 15.0% | 7.0% |
| Standard Deviation (Population) | 14.9% | 6.8% |
Similar Demographics by In Labor Force | Age 16-19
Demographics Similar to Yup'ik by In Labor Force | Age 16-19
In terms of in labor force | age 16-19, the demographic groups most similar to Yup'ik are Argentinean (33.3%, a difference of 0.10%), Immigrants from South America (33.3%, a difference of 0.12%), Jamaican (33.2%, a difference of 0.13%), Immigrants from Haiti (33.2%, a difference of 0.22%), and Haitian (33.4%, a difference of 0.44%).
| Demographics | Rating | Rank | In Labor Force | Age 16-19 |
| Immigrants | Indonesia | 0.1 /100 | #288 | Tragic 33.5% |
| Immigrants | Singapore | 0.1 /100 | #289 | Tragic 33.5% |
| Immigrants | Colombia | 0.1 /100 | #290 | Tragic 33.5% |
| Immigrants | Belarus | 0.1 /100 | #291 | Tragic 33.4% |
| Haitians | 0.1 /100 | #292 | Tragic 33.4% |
| Immigrants | South America | 0.1 /100 | #293 | Tragic 33.3% |
| Argentineans | 0.1 /100 | #294 | Tragic 33.3% |
| Yup'ik | 0.1 /100 | #295 | Tragic 33.3% |
| Jamaicans | 0.1 /100 | #296 | Tragic 33.2% |
| Immigrants | Haiti | 0.1 /100 | #297 | Tragic 33.2% |
| Iranians | 0.0 /100 | #298 | Tragic 33.0% |
| Armenians | 0.0 /100 | #299 | Tragic 32.9% |
| Immigrants | Argentina | 0.0 /100 | #300 | Tragic 32.9% |
| Okinawans | 0.0 /100 | #301 | Tragic 32.8% |
| Belizeans | 0.0 /100 | #302 | Tragic 32.8% |
Demographics Similar to Immigrants from Bulgaria by In Labor Force | Age 16-19
In terms of in labor force | age 16-19, the demographic groups most similar to Immigrants from Bulgaria are Arapaho (37.3%, a difference of 0.020%), Immigrants from Lithuania (37.2%, a difference of 0.070%), Kiowa (37.2%, a difference of 0.10%), Immigrants from Sierra Leone (37.3%, a difference of 0.17%), and Immigrants from Poland (37.3%, a difference of 0.25%).
| Demographics | Rating | Rank | In Labor Force | Age 16-19 |
| Brazilians | 88.7 /100 | #147 | Excellent 37.5% |
| Romanians | 87.3 /100 | #148 | Excellent 37.5% |
| Native Hawaiians | 85.0 /100 | #149 | Excellent 37.4% |
| Tsimshian | 84.7 /100 | #150 | Excellent 37.4% |
| Immigrants | Poland | 84.4 /100 | #151 | Excellent 37.3% |
| Immigrants | Sierra Leone | 83.6 /100 | #152 | Excellent 37.3% |
| Arapaho | 81.8 /100 | #153 | Excellent 37.3% |
| Immigrants | Bulgaria | 81.6 /100 | #154 | Excellent 37.3% |
| Immigrants | Lithuania | 80.7 /100 | #155 | Excellent 37.2% |
| Kiowa | 80.4 /100 | #156 | Excellent 37.2% |
| Immigrants | Brazil | 76.5 /100 | #157 | Good 37.1% |
| Ute | 75.7 /100 | #158 | Good 37.1% |
| Yaqui | 74.4 /100 | #159 | Good 37.1% |
| Immigrants | Saudi Arabia | 73.9 /100 | #160 | Good 37.0% |
| Cambodians | 71.5 /100 | #161 | Good 37.0% |