Yup'ik vs Immigrants from Jordan In Labor Force | Age 16-19
COMPARE
Yup'ik
Immigrants from Jordan
In Labor Force | Age 16-19
In Labor Force | Age 16-19 Comparison
Yup'ik
Immigrants from Jordan
33.3%
IN LABOR FORCE | AGE 16-19
0.1/ 100
METRIC RATING
295th/ 347
METRIC RANK
36.9%
IN LABOR FORCE | AGE 16-19
69.5/ 100
METRIC RATING
162nd/ 347
METRIC RANK
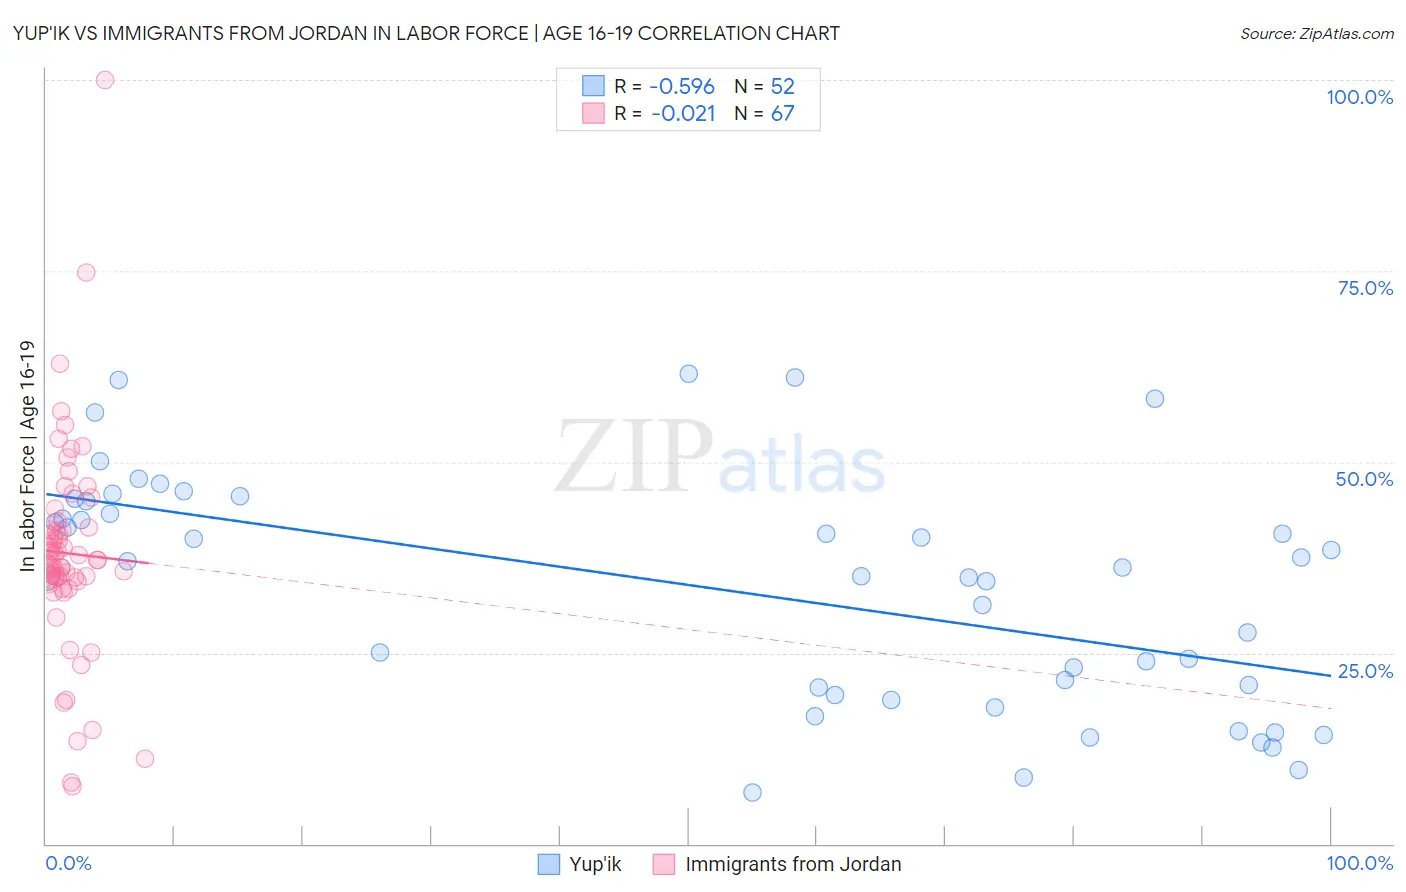
Yup'ik vs Immigrants from Jordan In Labor Force | Age 16-19 Correlation Chart
The statistical analysis conducted on geographies consisting of 39,923,752 people shows a substantial negative correlation between the proportion of Yup'ik and labor force participation rate among population between the ages 16 and 19 in the United States with a correlation coefficient (R) of -0.596 and weighted average of 33.3%. Similarly, the statistical analysis conducted on geographies consisting of 181,222,099 people shows no correlation between the proportion of Immigrants from Jordan and labor force participation rate among population between the ages 16 and 19 in the United States with a correlation coefficient (R) of -0.021 and weighted average of 36.9%, a difference of 11.1%.
In Labor Force | Age 16-19 Correlation Summary
| Measurement | Yup'ik | Immigrants from Jordan |
| Minimum | 6.7% | 7.6% |
| Maximum | 61.5% | 100.0% |
| Range | 54.8% | 92.4% |
| Mean | 33.3% | 38.0% |
| Median | 35.5% | 37.2% |
| Interquartile 25% (IQ1) | 19.9% | 34.6% |
| Interquartile 75% (IQ3) | 44.0% | 41.4% |
| Interquartile Range (IQR) | 24.1% | 6.8% |
| Standard Deviation (Sample) | 15.0% | 14.0% |
| Standard Deviation (Population) | 14.9% | 13.9% |
Similar Demographics by In Labor Force | Age 16-19
Demographics Similar to Yup'ik by In Labor Force | Age 16-19
In terms of in labor force | age 16-19, the demographic groups most similar to Yup'ik are Argentinean (33.3%, a difference of 0.10%), Immigrants from South America (33.3%, a difference of 0.12%), Jamaican (33.2%, a difference of 0.13%), Immigrants from Haiti (33.2%, a difference of 0.22%), and Haitian (33.4%, a difference of 0.44%).
| Demographics | Rating | Rank | In Labor Force | Age 16-19 |
| Immigrants | Indonesia | 0.1 /100 | #288 | Tragic 33.5% |
| Immigrants | Singapore | 0.1 /100 | #289 | Tragic 33.5% |
| Immigrants | Colombia | 0.1 /100 | #290 | Tragic 33.5% |
| Immigrants | Belarus | 0.1 /100 | #291 | Tragic 33.4% |
| Haitians | 0.1 /100 | #292 | Tragic 33.4% |
| Immigrants | South America | 0.1 /100 | #293 | Tragic 33.3% |
| Argentineans | 0.1 /100 | #294 | Tragic 33.3% |
| Yup'ik | 0.1 /100 | #295 | Tragic 33.3% |
| Jamaicans | 0.1 /100 | #296 | Tragic 33.2% |
| Immigrants | Haiti | 0.1 /100 | #297 | Tragic 33.2% |
| Iranians | 0.0 /100 | #298 | Tragic 33.0% |
| Armenians | 0.0 /100 | #299 | Tragic 32.9% |
| Immigrants | Argentina | 0.0 /100 | #300 | Tragic 32.9% |
| Okinawans | 0.0 /100 | #301 | Tragic 32.8% |
| Belizeans | 0.0 /100 | #302 | Tragic 32.8% |
Demographics Similar to Immigrants from Jordan by In Labor Force | Age 16-19
In terms of in labor force | age 16-19, the demographic groups most similar to Immigrants from Jordan are Bermudan (36.9%, a difference of 0.010%), Immigrants from Kuwait (36.9%, a difference of 0.040%), Cambodian (37.0%, a difference of 0.12%), Yakama (36.9%, a difference of 0.15%), and Immigrants from Western Africa (36.9%, a difference of 0.16%).
| Demographics | Rating | Rank | In Labor Force | Age 16-19 |
| Immigrants | Lithuania | 80.7 /100 | #155 | Excellent 37.2% |
| Kiowa | 80.4 /100 | #156 | Excellent 37.2% |
| Immigrants | Brazil | 76.5 /100 | #157 | Good 37.1% |
| Ute | 75.7 /100 | #158 | Good 37.1% |
| Yaqui | 74.4 /100 | #159 | Good 37.1% |
| Immigrants | Saudi Arabia | 73.9 /100 | #160 | Good 37.0% |
| Cambodians | 71.5 /100 | #161 | Good 37.0% |
| Immigrants | Jordan | 69.5 /100 | #162 | Good 36.9% |
| Bermudans | 69.3 /100 | #163 | Good 36.9% |
| Immigrants | Kuwait | 68.9 /100 | #164 | Good 36.9% |
| Yakama | 66.9 /100 | #165 | Good 36.9% |
| Immigrants | Western Africa | 66.7 /100 | #166 | Good 36.9% |
| Arabs | 63.6 /100 | #167 | Good 36.8% |
| Palestinians | 63.1 /100 | #168 | Good 36.8% |
| Immigrants | Latvia | 61.6 /100 | #169 | Good 36.8% |