Bahamian vs Iroquois In Labor Force | Age 16-19
COMPARE
Bahamian
Iroquois
In Labor Force | Age 16-19
In Labor Force | Age 16-19 Comparison
Bahamians
Iroquois
34.6%
IN LABOR FORCE | AGE 16-19
1.4/ 100
METRIC RATING
254th/ 347
METRIC RANK
39.9%
IN LABOR FORCE | AGE 16-19
99.9/ 100
METRIC RATING
72nd/ 347
METRIC RANK
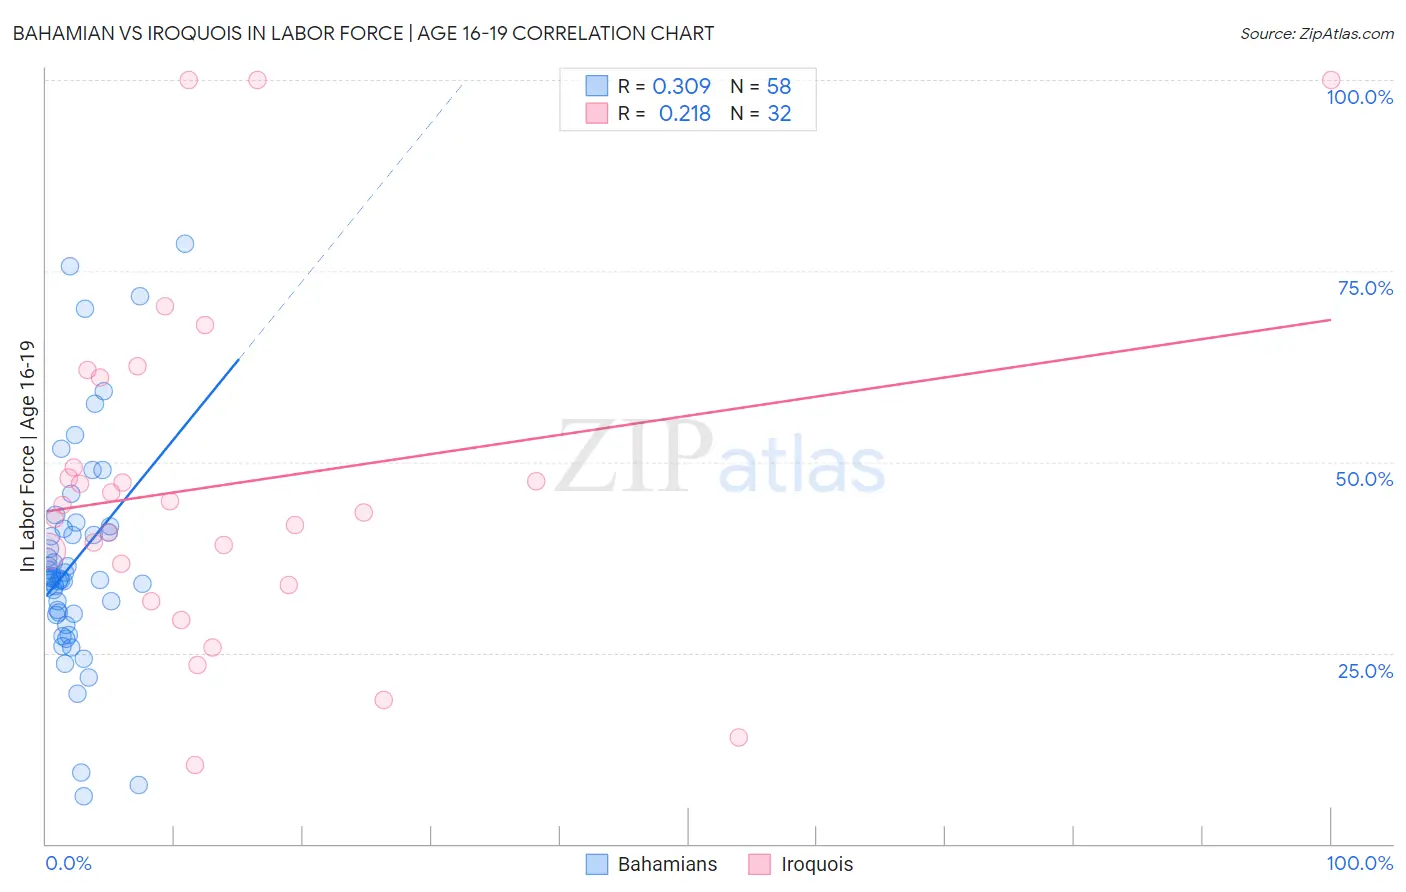
Bahamian vs Iroquois In Labor Force | Age 16-19 Correlation Chart
The statistical analysis conducted on geographies consisting of 112,651,679 people shows a mild positive correlation between the proportion of Bahamians and labor force participation rate among population between the ages 16 and 19 in the United States with a correlation coefficient (R) of 0.309 and weighted average of 34.6%. Similarly, the statistical analysis conducted on geographies consisting of 207,097,008 people shows a weak positive correlation between the proportion of Iroquois and labor force participation rate among population between the ages 16 and 19 in the United States with a correlation coefficient (R) of 0.218 and weighted average of 39.9%, a difference of 15.4%.
In Labor Force | Age 16-19 Correlation Summary
| Measurement | Bahamian | Iroquois |
| Minimum | 6.3% | 10.4% |
| Maximum | 78.5% | 100.0% |
| Range | 72.2% | 89.6% |
| Mean | 37.1% | 47.1% |
| Median | 34.6% | 43.8% |
| Interquartile 25% (IQ1) | 30.1% | 35.2% |
| Interquartile 75% (IQ3) | 41.2% | 55.2% |
| Interquartile Range (IQR) | 11.1% | 19.9% |
| Standard Deviation (Sample) | 14.4% | 22.3% |
| Standard Deviation (Population) | 14.3% | 22.0% |
Similar Demographics by In Labor Force | Age 16-19
Demographics Similar to Bahamians by In Labor Force | Age 16-19
In terms of in labor force | age 16-19, the demographic groups most similar to Bahamians are Peruvian (34.6%, a difference of 0.040%), Immigrants from Japan (34.7%, a difference of 0.12%), Immigrants from South Central Asia (34.6%, a difference of 0.15%), Immigrants from Egypt (34.6%, a difference of 0.15%), and Thai (34.6%, a difference of 0.16%).
| Demographics | Rating | Rank | In Labor Force | Age 16-19 |
| Laotians | 2.4 /100 | #247 | Tragic 34.9% |
| Central Americans | 2.2 /100 | #248 | Tragic 34.8% |
| Immigrants | Ukraine | 2.2 /100 | #249 | Tragic 34.8% |
| Immigrants | Pakistan | 2.0 /100 | #250 | Tragic 34.8% |
| Immigrants | Western Asia | 2.0 /100 | #251 | Tragic 34.8% |
| Immigrants | Chile | 2.0 /100 | #252 | Tragic 34.8% |
| Immigrants | Japan | 1.5 /100 | #253 | Tragic 34.7% |
| Bahamians | 1.4 /100 | #254 | Tragic 34.6% |
| Peruvians | 1.4 /100 | #255 | Tragic 34.6% |
| Immigrants | South Central Asia | 1.3 /100 | #256 | Tragic 34.6% |
| Immigrants | Egypt | 1.2 /100 | #257 | Tragic 34.6% |
| Thais | 1.2 /100 | #258 | Tragic 34.6% |
| Immigrants | Immigrants | 1.2 /100 | #259 | Tragic 34.6% |
| Egyptians | 1.2 /100 | #260 | Tragic 34.5% |
| Salvadorans | 1.1 /100 | #261 | Tragic 34.5% |
Demographics Similar to Iroquois by In Labor Force | Age 16-19
In terms of in labor force | age 16-19, the demographic groups most similar to Iroquois are Serbian (39.9%, a difference of 0.010%), Immigrants from Middle Africa (39.9%, a difference of 0.030%), Portuguese (40.0%, a difference of 0.17%), Potawatomi (40.0%, a difference of 0.22%), and Hungarian (39.8%, a difference of 0.26%).
| Demographics | Rating | Rank | In Labor Force | Age 16-19 |
| Kenyans | 100.0 /100 | #65 | Exceptional 40.1% |
| Immigrants | Nonimmigrants | 100.0 /100 | #66 | Exceptional 40.1% |
| Canadians | 100.0 /100 | #67 | Exceptional 40.1% |
| Italians | 99.9 /100 | #68 | Exceptional 40.1% |
| Potawatomi | 99.9 /100 | #69 | Exceptional 40.0% |
| Portuguese | 99.9 /100 | #70 | Exceptional 40.0% |
| Serbians | 99.9 /100 | #71 | Exceptional 39.9% |
| Iroquois | 99.9 /100 | #72 | Exceptional 39.9% |
| Immigrants | Middle Africa | 99.9 /100 | #73 | Exceptional 39.9% |
| Hungarians | 99.9 /100 | #74 | Exceptional 39.8% |
| French American Indians | 99.9 /100 | #75 | Exceptional 39.8% |
| Malaysians | 99.9 /100 | #76 | Exceptional 39.7% |
| Immigrants | Portugal | 99.9 /100 | #77 | Exceptional 39.7% |
| Austrians | 99.8 /100 | #78 | Exceptional 39.5% |
| Marshallese | 99.8 /100 | #79 | Exceptional 39.5% |