Immigrants from Sweden vs Arab In Labor Force | Age > 16
COMPARE
Immigrants from Sweden
Arab
In Labor Force | Age > 16
In Labor Force | Age > 16 Comparison
Immigrants from Sweden
Arabs
65.2%
IN LABOR FORCE | AGE > 16
61.3/ 100
METRIC RATING
172nd/ 347
METRIC RANK
65.2%
IN LABOR FORCE | AGE > 16
62.4/ 100
METRIC RATING
169th/ 347
METRIC RANK
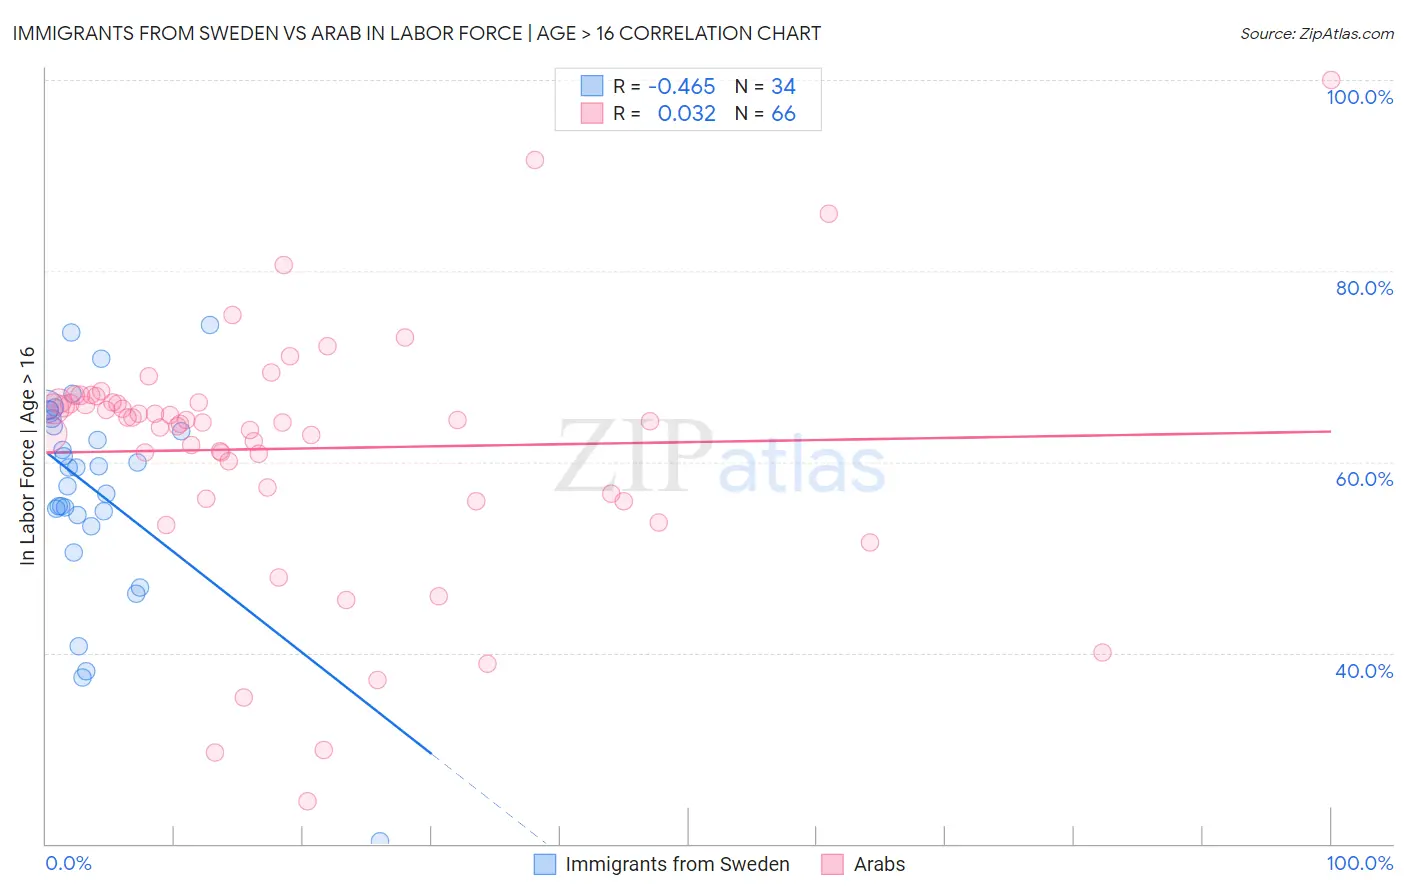
Immigrants from Sweden vs Arab In Labor Force | Age > 16 Correlation Chart
The statistical analysis conducted on geographies consisting of 164,749,853 people shows a moderate negative correlation between the proportion of Immigrants from Sweden and labor force participation rate among population ages 16 and over in the United States with a correlation coefficient (R) of -0.465 and weighted average of 65.2%. Similarly, the statistical analysis conducted on geographies consisting of 486,878,981 people shows no correlation between the proportion of Arabs and labor force participation rate among population ages 16 and over in the United States with a correlation coefficient (R) of 0.032 and weighted average of 65.2%, a difference of 0.010%.
In Labor Force | Age > 16 Correlation Summary
| Measurement | Immigrants from Sweden | Arab |
| Minimum | 20.3% | 24.4% |
| Maximum | 74.3% | 100.0% |
| Range | 54.0% | 75.6% |
| Mean | 57.1% | 61.4% |
| Median | 59.4% | 64.2% |
| Interquartile 25% (IQ1) | 54.4% | 56.7% |
| Interquartile 75% (IQ3) | 64.5% | 66.2% |
| Interquartile Range (IQR) | 10.1% | 9.5% |
| Standard Deviation (Sample) | 11.1% | 13.1% |
| Standard Deviation (Population) | 10.9% | 13.0% |
Demographics Similar to Immigrants from Sweden and Arabs by In Labor Force | Age > 16
In terms of in labor force | age > 16, the demographic groups most similar to Immigrants from Sweden are Immigrants from Israel (65.2%, a difference of 0.0%), Israeli (65.2%, a difference of 0.0%), Serbian (65.2%, a difference of 0.030%), Immigrants from Belarus (65.2%, a difference of 0.060%), and Immigrants from Western Asia (65.3%, a difference of 0.070%). Similarly, the demographic groups most similar to Arabs are Serbian (65.2%, a difference of 0.010%), Immigrants from Israel (65.2%, a difference of 0.010%), Israeli (65.2%, a difference of 0.010%), Immigrants from Belarus (65.2%, a difference of 0.040%), and Immigrants from Western Asia (65.3%, a difference of 0.060%).
| Demographics | Rating | Rank | In Labor Force | Age > 16 |
| Immigrants | South Africa | 73.5 /100 | #160 | Good 65.3% |
| Australians | 71.3 /100 | #161 | Good 65.3% |
| Albanians | 70.8 /100 | #162 | Good 65.3% |
| South Africans | 69.8 /100 | #163 | Good 65.3% |
| Danes | 68.8 /100 | #164 | Good 65.3% |
| Immigrants | Kazakhstan | 68.1 /100 | #165 | Good 65.3% |
| Immigrants | Western Asia | 67.3 /100 | #166 | Good 65.3% |
| Immigrants | Belarus | 66.0 /100 | #167 | Good 65.2% |
| Serbians | 63.5 /100 | #168 | Good 65.2% |
| Arabs | 62.4 /100 | #169 | Good 65.2% |
| Immigrants | Israel | 61.7 /100 | #170 | Good 65.2% |
| Israelis | 61.6 /100 | #171 | Good 65.2% |
| Immigrants | Sweden | 61.3 /100 | #172 | Good 65.2% |
| Immigrants | Ukraine | 53.7 /100 | #173 | Average 65.1% |
| Macedonians | 50.0 /100 | #174 | Average 65.1% |
| Nicaraguans | 49.7 /100 | #175 | Average 65.1% |
| Swedes | 47.4 /100 | #176 | Average 65.1% |
| Eastern Europeans | 46.2 /100 | #177 | Average 65.1% |
| Trinidadians and Tobagonians | 45.2 /100 | #178 | Average 65.1% |
| Immigrants | Haiti | 43.3 /100 | #179 | Average 65.1% |
| Immigrants | Latvia | 42.9 /100 | #180 | Average 65.1% |