West Indian vs French American Indian In Labor Force | Age 16-19
COMPARE
West Indian
French American Indian
In Labor Force | Age 16-19
In Labor Force | Age 16-19 Comparison
West Indians
French American Indians
31.3%
IN LABOR FORCE | AGE 16-19
0.0/ 100
METRIC RATING
321st/ 347
METRIC RANK
39.8%
IN LABOR FORCE | AGE 16-19
99.9/ 100
METRIC RATING
75th/ 347
METRIC RANK
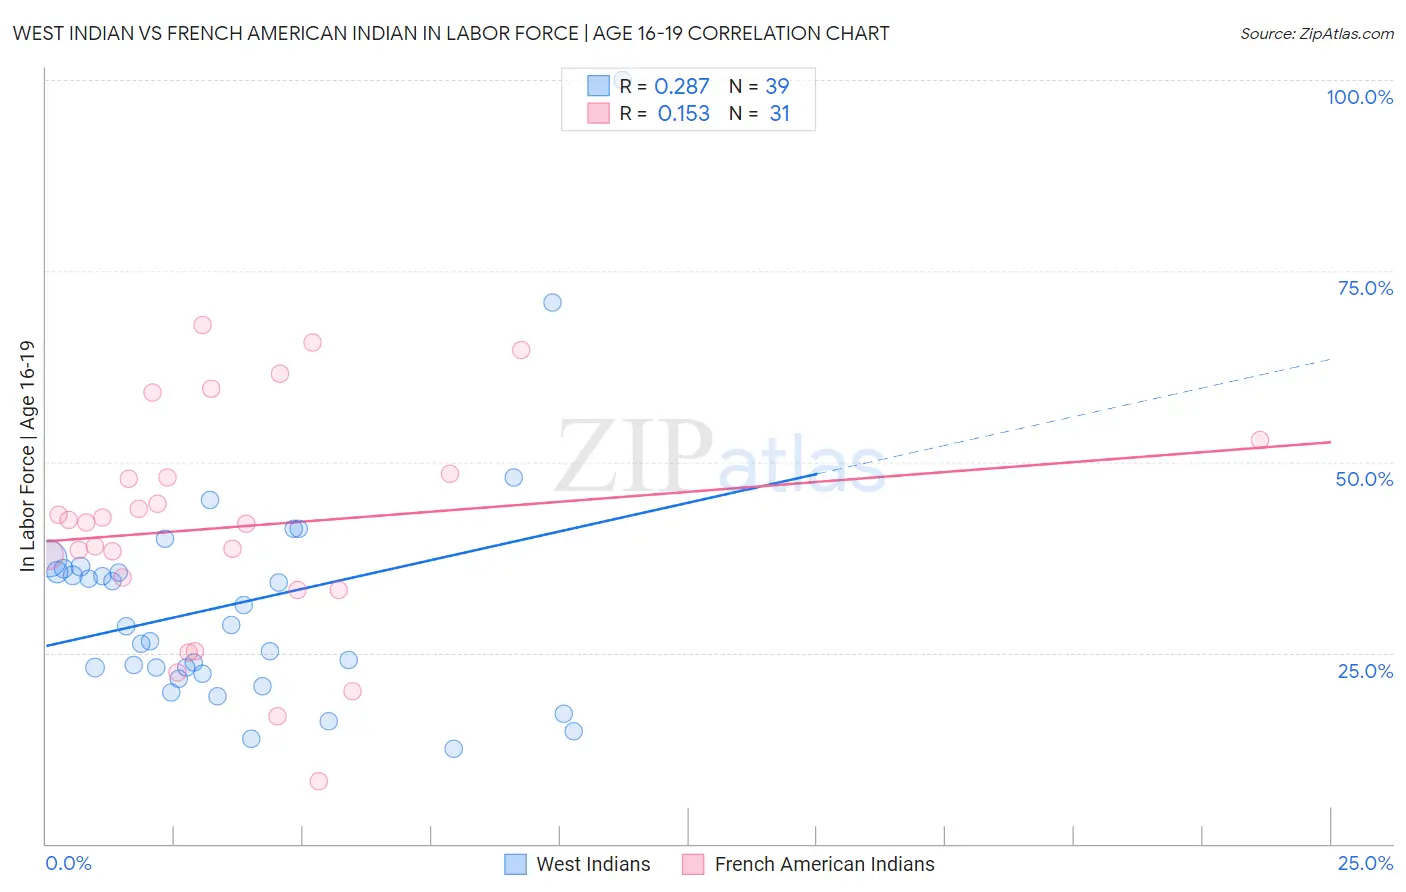
West Indian vs French American Indian In Labor Force | Age 16-19 Correlation Chart
The statistical analysis conducted on geographies consisting of 253,845,757 people shows a weak positive correlation between the proportion of West Indians and labor force participation rate among population between the ages 16 and 19 in the United States with a correlation coefficient (R) of 0.287 and weighted average of 31.3%. Similarly, the statistical analysis conducted on geographies consisting of 131,885,422 people shows a poor positive correlation between the proportion of French American Indians and labor force participation rate among population between the ages 16 and 19 in the United States with a correlation coefficient (R) of 0.153 and weighted average of 39.8%, a difference of 27.2%.
In Labor Force | Age 16-19 Correlation Summary
| Measurement | West Indian | French American Indian |
| Minimum | 12.5% | 8.2% |
| Maximum | 100.0% | 68.0% |
| Range | 87.5% | 59.8% |
| Mean | 31.4% | 41.5% |
| Median | 28.5% | 42.0% |
| Interquartile 25% (IQ1) | 22.3% | 33.3% |
| Interquartile 75% (IQ3) | 35.9% | 48.4% |
| Interquartile Range (IQR) | 13.6% | 15.1% |
| Standard Deviation (Sample) | 15.9% | 14.7% |
| Standard Deviation (Population) | 15.7% | 14.4% |
Similar Demographics by In Labor Force | Age 16-19
Demographics Similar to West Indians by In Labor Force | Age 16-19
In terms of in labor force | age 16-19, the demographic groups most similar to West Indians are Tohono O'odham (31.3%, a difference of 0.12%), Ecuadorian (31.4%, a difference of 0.23%), Immigrants from Caribbean (31.2%, a difference of 0.25%), Soviet Union (31.4%, a difference of 0.30%), and Dominican (31.2%, a difference of 0.43%).
| Demographics | Rating | Rank | In Labor Force | Age 16-19 |
| Cubans | 0.0 /100 | #314 | Tragic 31.8% |
| Immigrants | West Indies | 0.0 /100 | #315 | Tragic 31.7% |
| Filipinos | 0.0 /100 | #316 | Tragic 31.7% |
| Immigrants | Nicaragua | 0.0 /100 | #317 | Tragic 31.6% |
| Immigrants | Yemen | 0.0 /100 | #318 | Tragic 31.5% |
| Soviet Union | 0.0 /100 | #319 | Tragic 31.4% |
| Ecuadorians | 0.0 /100 | #320 | Tragic 31.4% |
| West Indians | 0.0 /100 | #321 | Tragic 31.3% |
| Tohono O'odham | 0.0 /100 | #322 | Tragic 31.3% |
| Immigrants | Caribbean | 0.0 /100 | #323 | Tragic 31.2% |
| Dominicans | 0.0 /100 | #324 | Tragic 31.2% |
| Immigrants | China | 0.0 /100 | #325 | Tragic 31.1% |
| Immigrants | Dominican Republic | 0.0 /100 | #326 | Tragic 31.1% |
| Immigrants | Taiwan | 0.0 /100 | #327 | Tragic 31.0% |
| Immigrants | Ecuador | 0.0 /100 | #328 | Tragic 31.0% |
Demographics Similar to French American Indians by In Labor Force | Age 16-19
In terms of in labor force | age 16-19, the demographic groups most similar to French American Indians are Hungarian (39.8%, a difference of 0.020%), Immigrants from Middle Africa (39.9%, a difference of 0.25%), Malaysian (39.7%, a difference of 0.27%), Serbian (39.9%, a difference of 0.29%), and Iroquois (39.9%, a difference of 0.29%).
| Demographics | Rating | Rank | In Labor Force | Age 16-19 |
| Italians | 99.9 /100 | #68 | Exceptional 40.1% |
| Potawatomi | 99.9 /100 | #69 | Exceptional 40.0% |
| Portuguese | 99.9 /100 | #70 | Exceptional 40.0% |
| Serbians | 99.9 /100 | #71 | Exceptional 39.9% |
| Iroquois | 99.9 /100 | #72 | Exceptional 39.9% |
| Immigrants | Middle Africa | 99.9 /100 | #73 | Exceptional 39.9% |
| Hungarians | 99.9 /100 | #74 | Exceptional 39.8% |
| French American Indians | 99.9 /100 | #75 | Exceptional 39.8% |
| Malaysians | 99.9 /100 | #76 | Exceptional 39.7% |
| Immigrants | Portugal | 99.9 /100 | #77 | Exceptional 39.7% |
| Austrians | 99.8 /100 | #78 | Exceptional 39.5% |
| Marshallese | 99.8 /100 | #79 | Exceptional 39.5% |
| Immigrants | Iraq | 99.8 /100 | #80 | Exceptional 39.4% |
| Shoshone | 99.7 /100 | #81 | Exceptional 39.3% |
| Basques | 99.7 /100 | #82 | Exceptional 39.3% |