West Indian vs South American Indian In Labor Force | Age 16-19
COMPARE
West Indian
South American Indian
In Labor Force | Age 16-19
In Labor Force | Age 16-19 Comparison
West Indians
South American Indians
31.3%
IN LABOR FORCE | AGE 16-19
0.0/ 100
METRIC RATING
321st/ 347
METRIC RANK
35.8%
IN LABOR FORCE | AGE 16-19
14.6/ 100
METRIC RATING
205th/ 347
METRIC RANK
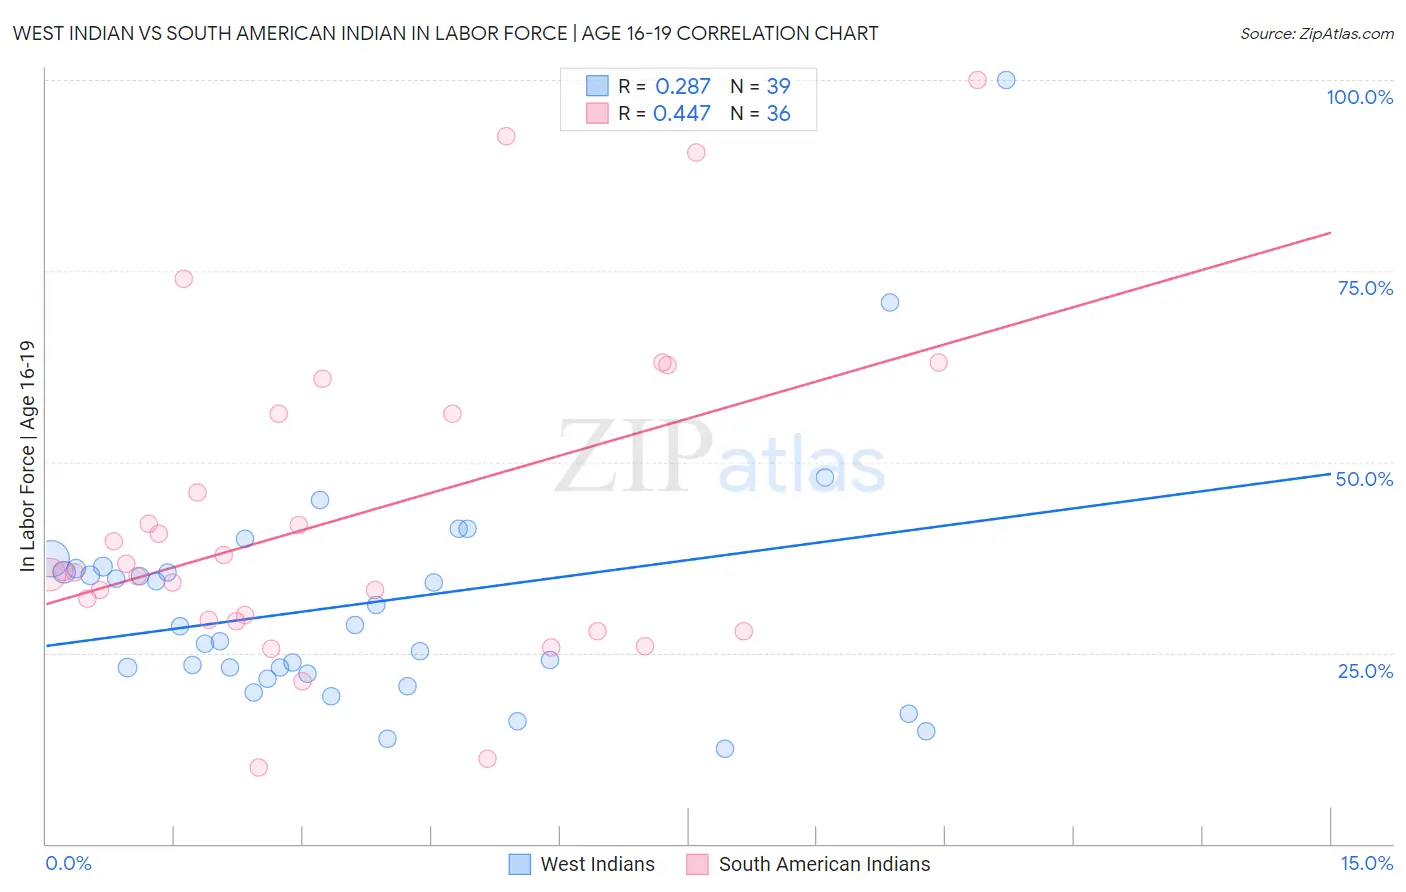
West Indian vs South American Indian In Labor Force | Age 16-19 Correlation Chart
The statistical analysis conducted on geographies consisting of 253,845,757 people shows a weak positive correlation between the proportion of West Indians and labor force participation rate among population between the ages 16 and 19 in the United States with a correlation coefficient (R) of 0.287 and weighted average of 31.3%. Similarly, the statistical analysis conducted on geographies consisting of 164,452,175 people shows a moderate positive correlation between the proportion of South American Indians and labor force participation rate among population between the ages 16 and 19 in the United States with a correlation coefficient (R) of 0.447 and weighted average of 35.8%, a difference of 14.2%.
In Labor Force | Age 16-19 Correlation Summary
| Measurement | West Indian | South American Indian |
| Minimum | 12.5% | 10.0% |
| Maximum | 100.0% | 100.0% |
| Range | 87.5% | 90.0% |
| Mean | 31.4% | 42.8% |
| Median | 28.5% | 35.6% |
| Interquartile 25% (IQ1) | 22.3% | 29.3% |
| Interquartile 75% (IQ3) | 35.9% | 56.3% |
| Interquartile Range (IQR) | 13.6% | 27.0% |
| Standard Deviation (Sample) | 15.9% | 21.4% |
| Standard Deviation (Population) | 15.7% | 21.1% |
Similar Demographics by In Labor Force | Age 16-19
Demographics Similar to West Indians by In Labor Force | Age 16-19
In terms of in labor force | age 16-19, the demographic groups most similar to West Indians are Tohono O'odham (31.3%, a difference of 0.12%), Ecuadorian (31.4%, a difference of 0.23%), Immigrants from Caribbean (31.2%, a difference of 0.25%), Soviet Union (31.4%, a difference of 0.30%), and Dominican (31.2%, a difference of 0.43%).
| Demographics | Rating | Rank | In Labor Force | Age 16-19 |
| Cubans | 0.0 /100 | #314 | Tragic 31.8% |
| Immigrants | West Indies | 0.0 /100 | #315 | Tragic 31.7% |
| Filipinos | 0.0 /100 | #316 | Tragic 31.7% |
| Immigrants | Nicaragua | 0.0 /100 | #317 | Tragic 31.6% |
| Immigrants | Yemen | 0.0 /100 | #318 | Tragic 31.5% |
| Soviet Union | 0.0 /100 | #319 | Tragic 31.4% |
| Ecuadorians | 0.0 /100 | #320 | Tragic 31.4% |
| West Indians | 0.0 /100 | #321 | Tragic 31.3% |
| Tohono O'odham | 0.0 /100 | #322 | Tragic 31.3% |
| Immigrants | Caribbean | 0.0 /100 | #323 | Tragic 31.2% |
| Dominicans | 0.0 /100 | #324 | Tragic 31.2% |
| Immigrants | China | 0.0 /100 | #325 | Tragic 31.1% |
| Immigrants | Dominican Republic | 0.0 /100 | #326 | Tragic 31.1% |
| Immigrants | Taiwan | 0.0 /100 | #327 | Tragic 31.0% |
| Immigrants | Ecuador | 0.0 /100 | #328 | Tragic 31.0% |
Demographics Similar to South American Indians by In Labor Force | Age 16-19
In terms of in labor force | age 16-19, the demographic groups most similar to South American Indians are Chilean (35.8%, a difference of 0.0%), Immigrants from Eastern Europe (35.8%, a difference of 0.020%), Immigrants from Albania (35.8%, a difference of 0.040%), Korean (35.7%, a difference of 0.14%), and Immigrants from Nigeria (35.8%, a difference of 0.21%).
| Demographics | Rating | Rank | In Labor Force | Age 16-19 |
| Immigrants | Northern Africa | 19.9 /100 | #198 | Poor 35.9% |
| Immigrants | Norway | 19.8 /100 | #199 | Poor 35.9% |
| Immigrants | Sweden | 18.8 /100 | #200 | Poor 35.9% |
| Alsatians | 17.5 /100 | #201 | Poor 35.9% |
| Senegalese | 17.4 /100 | #202 | Poor 35.9% |
| Immigrants | Nigeria | 16.8 /100 | #203 | Poor 35.8% |
| Immigrants | Albania | 15.0 /100 | #204 | Poor 35.8% |
| South American Indians | 14.6 /100 | #205 | Poor 35.8% |
| Chileans | 14.6 /100 | #206 | Poor 35.8% |
| Immigrants | Eastern Europe | 14.5 /100 | #207 | Poor 35.8% |
| Koreans | 13.3 /100 | #208 | Poor 35.7% |
| Moroccans | 12.7 /100 | #209 | Poor 35.7% |
| Immigrants | Switzerland | 11.9 /100 | #210 | Poor 35.6% |
| Mexicans | 11.9 /100 | #211 | Poor 35.6% |
| Houma | 11.0 /100 | #212 | Poor 35.6% |