West Indian vs Assyrian/Chaldean/Syriac In Labor Force | Age 16-19
COMPARE
West Indian
Assyrian/Chaldean/Syriac
In Labor Force | Age 16-19
In Labor Force | Age 16-19 Comparison
West Indians
Assyrians/Chaldeans/Syriacs
31.3%
IN LABOR FORCE | AGE 16-19
0.0/ 100
METRIC RATING
321st/ 347
METRIC RANK
38.3%
IN LABOR FORCE | AGE 16-19
97.8/ 100
METRIC RATING
119th/ 347
METRIC RANK
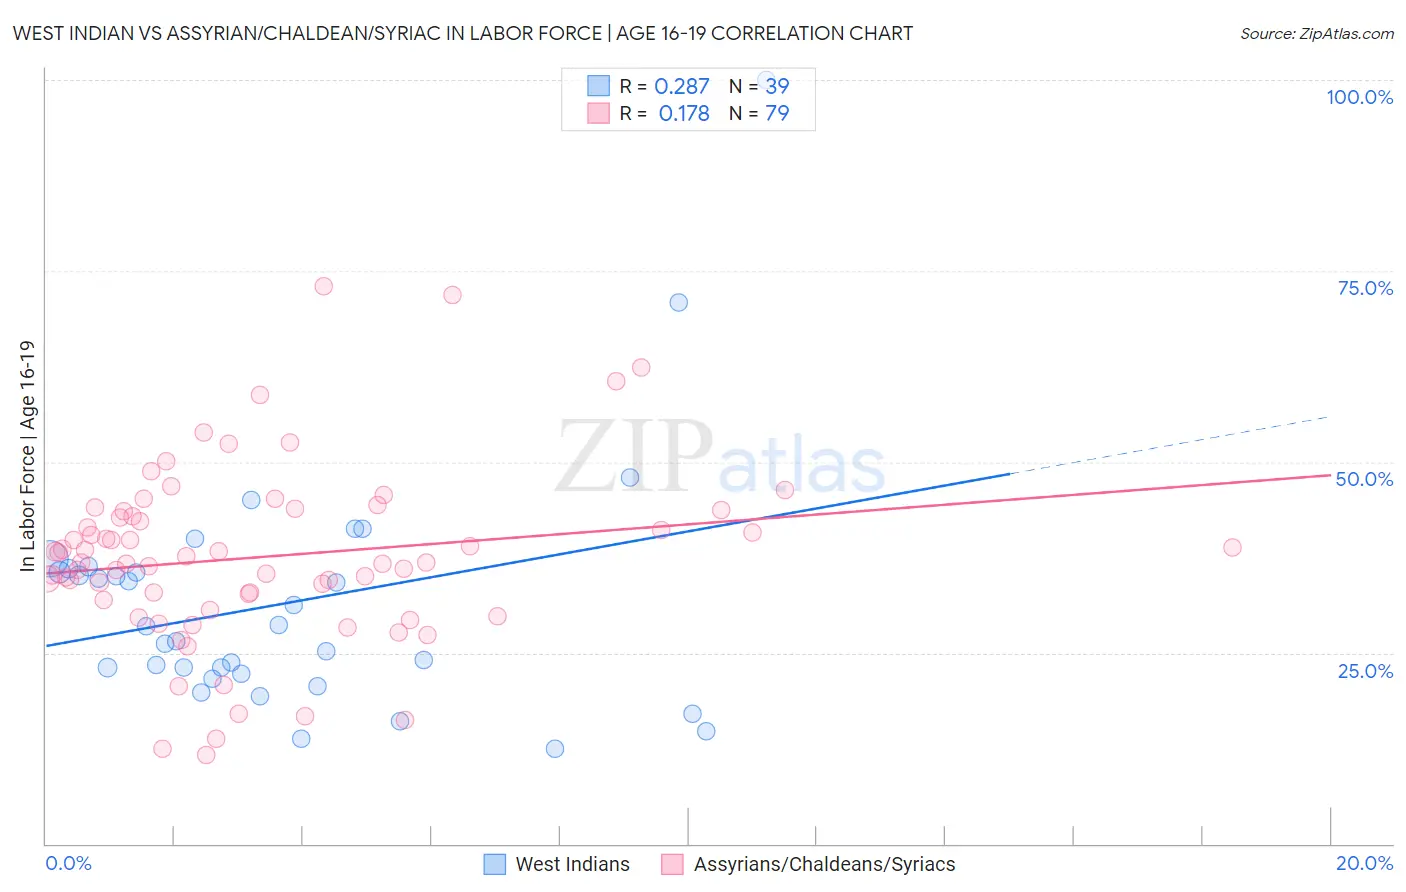
West Indian vs Assyrian/Chaldean/Syriac In Labor Force | Age 16-19 Correlation Chart
The statistical analysis conducted on geographies consisting of 253,845,757 people shows a weak positive correlation between the proportion of West Indians and labor force participation rate among population between the ages 16 and 19 in the United States with a correlation coefficient (R) of 0.287 and weighted average of 31.3%. Similarly, the statistical analysis conducted on geographies consisting of 110,301,649 people shows a poor positive correlation between the proportion of Assyrians/Chaldeans/Syriacs and labor force participation rate among population between the ages 16 and 19 in the United States with a correlation coefficient (R) of 0.178 and weighted average of 38.3%, a difference of 22.3%.
In Labor Force | Age 16-19 Correlation Summary
| Measurement | West Indian | Assyrian/Chaldean/Syriac |
| Minimum | 12.5% | 11.7% |
| Maximum | 100.0% | 73.0% |
| Range | 87.5% | 61.3% |
| Mean | 31.4% | 37.5% |
| Median | 28.5% | 36.8% |
| Interquartile 25% (IQ1) | 22.3% | 31.8% |
| Interquartile 75% (IQ3) | 35.9% | 43.5% |
| Interquartile Range (IQR) | 13.6% | 11.7% |
| Standard Deviation (Sample) | 15.9% | 11.6% |
| Standard Deviation (Population) | 15.7% | 11.6% |
Similar Demographics by In Labor Force | Age 16-19
Demographics Similar to West Indians by In Labor Force | Age 16-19
In terms of in labor force | age 16-19, the demographic groups most similar to West Indians are Tohono O'odham (31.3%, a difference of 0.12%), Ecuadorian (31.4%, a difference of 0.23%), Immigrants from Caribbean (31.2%, a difference of 0.25%), Soviet Union (31.4%, a difference of 0.30%), and Dominican (31.2%, a difference of 0.43%).
| Demographics | Rating | Rank | In Labor Force | Age 16-19 |
| Cubans | 0.0 /100 | #314 | Tragic 31.8% |
| Immigrants | West Indies | 0.0 /100 | #315 | Tragic 31.7% |
| Filipinos | 0.0 /100 | #316 | Tragic 31.7% |
| Immigrants | Nicaragua | 0.0 /100 | #317 | Tragic 31.6% |
| Immigrants | Yemen | 0.0 /100 | #318 | Tragic 31.5% |
| Soviet Union | 0.0 /100 | #319 | Tragic 31.4% |
| Ecuadorians | 0.0 /100 | #320 | Tragic 31.4% |
| West Indians | 0.0 /100 | #321 | Tragic 31.3% |
| Tohono O'odham | 0.0 /100 | #322 | Tragic 31.3% |
| Immigrants | Caribbean | 0.0 /100 | #323 | Tragic 31.2% |
| Dominicans | 0.0 /100 | #324 | Tragic 31.2% |
| Immigrants | China | 0.0 /100 | #325 | Tragic 31.1% |
| Immigrants | Dominican Republic | 0.0 /100 | #326 | Tragic 31.1% |
| Immigrants | Taiwan | 0.0 /100 | #327 | Tragic 31.0% |
| Immigrants | Ecuador | 0.0 /100 | #328 | Tragic 31.0% |
Demographics Similar to Assyrians/Chaldeans/Syriacs by In Labor Force | Age 16-19
In terms of in labor force | age 16-19, the demographic groups most similar to Assyrians/Chaldeans/Syriacs are Immigrants from Nepal (38.3%, a difference of 0.020%), Chickasaw (38.3%, a difference of 0.030%), Bulgarian (38.3%, a difference of 0.080%), Colville (38.3%, a difference of 0.080%), and Ukrainian (38.3%, a difference of 0.090%).
| Demographics | Rating | Rank | In Labor Force | Age 16-19 |
| Immigrants | Scotland | 98.5 /100 | #112 | Exceptional 38.5% |
| Sub-Saharan Africans | 98.3 /100 | #113 | Exceptional 38.4% |
| Hawaiians | 98.2 /100 | #114 | Exceptional 38.4% |
| Bulgarians | 97.9 /100 | #115 | Exceptional 38.3% |
| Colville | 97.9 /100 | #116 | Exceptional 38.3% |
| Chickasaw | 97.8 /100 | #117 | Exceptional 38.3% |
| Immigrants | Nepal | 97.8 /100 | #118 | Exceptional 38.3% |
| Assyrians/Chaldeans/Syriacs | 97.8 /100 | #119 | Exceptional 38.3% |
| Ukrainians | 97.6 /100 | #120 | Exceptional 38.3% |
| Ethiopians | 97.4 /100 | #121 | Exceptional 38.2% |
| Guamanians/Chamorros | 97.4 /100 | #122 | Exceptional 38.2% |
| Seminole | 96.7 /100 | #123 | Exceptional 38.1% |
| Immigrants | England | 96.4 /100 | #124 | Exceptional 38.1% |
| Immigrants | Africa | 96.1 /100 | #125 | Exceptional 38.0% |
| Africans | 95.6 /100 | #126 | Exceptional 38.0% |