Welsh vs Immigrants from Colombia In Labor Force | Age 25-29
COMPARE
Welsh
Immigrants from Colombia
In Labor Force | Age 25-29
In Labor Force | Age 25-29 Comparison
Welsh
Immigrants from Colombia
84.5%
IN LABOR FORCE | AGE 25-29
31.1/ 100
METRIC RATING
190th/ 347
METRIC RANK
84.7%
IN LABOR FORCE | AGE 25-29
58.3/ 100
METRIC RATING
162nd/ 347
METRIC RANK
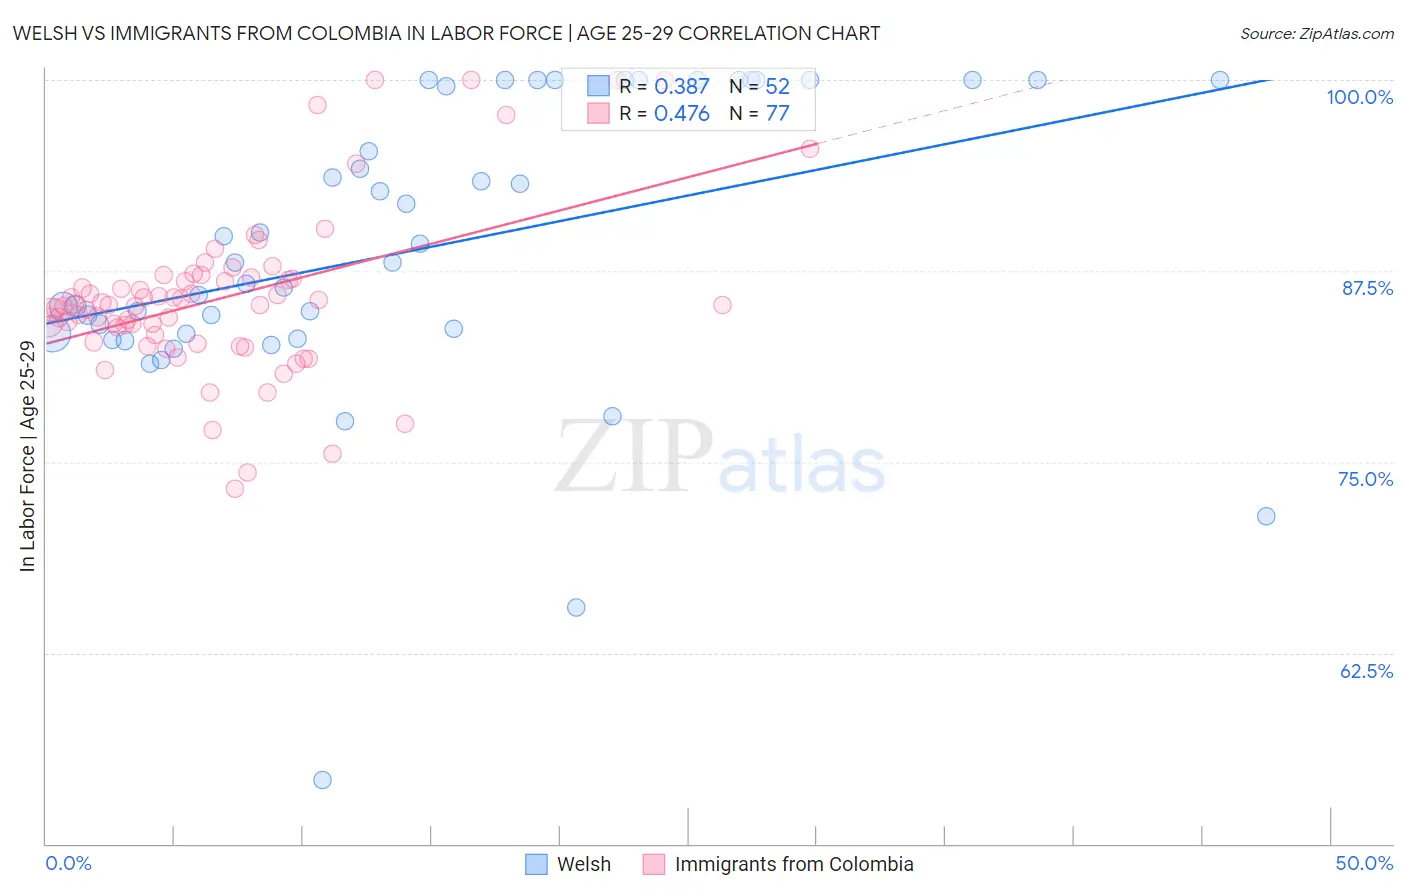
Welsh vs Immigrants from Colombia In Labor Force | Age 25-29 Correlation Chart
The statistical analysis conducted on geographies consisting of 527,913,112 people shows a mild positive correlation between the proportion of Welsh and labor force participation rate among population between the ages 25 and 29 in the United States with a correlation coefficient (R) of 0.387 and weighted average of 84.5%. Similarly, the statistical analysis conducted on geographies consisting of 378,572,642 people shows a moderate positive correlation between the proportion of Immigrants from Colombia and labor force participation rate among population between the ages 25 and 29 in the United States with a correlation coefficient (R) of 0.476 and weighted average of 84.7%, a difference of 0.21%.
In Labor Force | Age 25-29 Correlation Summary
| Measurement | Welsh | Immigrants from Colombia |
| Minimum | 54.2% | 73.2% |
| Maximum | 100.0% | 100.0% |
| Range | 45.8% | 26.8% |
| Mean | 89.0% | 85.8% |
| Median | 88.1% | 85.3% |
| Interquartile 25% (IQ1) | 83.4% | 83.1% |
| Interquartile 75% (IQ3) | 100.0% | 87.0% |
| Interquartile Range (IQR) | 16.6% | 3.9% |
| Standard Deviation (Sample) | 9.7% | 5.4% |
| Standard Deviation (Population) | 9.6% | 5.3% |
Similar Demographics by In Labor Force | Age 25-29
Demographics Similar to Welsh by In Labor Force | Age 25-29
In terms of in labor force | age 25-29, the demographic groups most similar to Welsh are Moroccan (84.5%, a difference of 0.010%), Immigrants from Ukraine (84.5%, a difference of 0.020%), Zimbabwean (84.5%, a difference of 0.020%), Immigrants from Belgium (84.6%, a difference of 0.030%), and Immigrants from Portugal (84.6%, a difference of 0.030%).
| Demographics | Rating | Rank | In Labor Force | Age 25-29 |
| Scottish | 40.1 /100 | #183 | Average 84.6% |
| Immigrants | Kuwait | 38.2 /100 | #184 | Fair 84.6% |
| Immigrants | Denmark | 37.0 /100 | #185 | Fair 84.6% |
| Immigrants | Belgium | 35.0 /100 | #186 | Fair 84.6% |
| Immigrants | Portugal | 34.7 /100 | #187 | Fair 84.6% |
| Immigrants | Ukraine | 33.7 /100 | #188 | Fair 84.5% |
| Moroccans | 32.6 /100 | #189 | Fair 84.5% |
| Welsh | 31.1 /100 | #190 | Fair 84.5% |
| Zimbabweans | 28.7 /100 | #191 | Fair 84.5% |
| English | 25.8 /100 | #192 | Fair 84.5% |
| South American Indians | 25.0 /100 | #193 | Fair 84.5% |
| Portuguese | 21.2 /100 | #194 | Fair 84.4% |
| Immigrants | Israel | 20.8 /100 | #195 | Fair 84.4% |
| Immigrants | South Eastern Asia | 19.5 /100 | #196 | Poor 84.4% |
| Tlingit-Haida | 19.3 /100 | #197 | Poor 84.4% |
Demographics Similar to Immigrants from Colombia by In Labor Force | Age 25-29
In terms of in labor force | age 25-29, the demographic groups most similar to Immigrants from Colombia are Immigrants from Peru (84.7%, a difference of 0.0%), Canadian (84.7%, a difference of 0.0%), Argentinean (84.7%, a difference of 0.0%), Ghanaian (84.7%, a difference of 0.0%), and Immigrants from Ghana (84.7%, a difference of 0.010%).
| Demographics | Rating | Rank | In Labor Force | Age 25-29 |
| Indians (Asian) | 61.6 /100 | #155 | Good 84.7% |
| French | 61.0 /100 | #156 | Good 84.7% |
| British | 60.4 /100 | #157 | Good 84.7% |
| Immigrants | Ghana | 60.2 /100 | #158 | Good 84.7% |
| Immigrants | Western Africa | 60.1 /100 | #159 | Good 84.7% |
| Immigrants | Peru | 58.6 /100 | #160 | Average 84.7% |
| Canadians | 58.5 /100 | #161 | Average 84.7% |
| Immigrants | Colombia | 58.3 /100 | #162 | Average 84.7% |
| Argentineans | 57.9 /100 | #163 | Average 84.7% |
| Ghanaians | 57.6 /100 | #164 | Average 84.7% |
| Immigrants | Burma/Myanmar | 57.4 /100 | #165 | Average 84.7% |
| Immigrants | Spain | 56.9 /100 | #166 | Average 84.7% |
| Indonesians | 56.5 /100 | #167 | Average 84.7% |
| South Americans | 54.9 /100 | #168 | Average 84.7% |
| Celtics | 52.5 /100 | #169 | Average 84.7% |