Welsh vs Yaqui Householder Income Over 65 years
COMPARE
Welsh
Yaqui
Householder Income Over 65 years
Householder Income Over 65 years Comparison
Welsh
Yaqui
$60,666
HOUSEHOLDER INCOME OVER 65 YEARS
42.2/ 100
METRIC RATING
179th/ 347
METRIC RANK
$56,417
HOUSEHOLDER INCOME OVER 65 YEARS
0.8/ 100
METRIC RATING
242nd/ 347
METRIC RANK
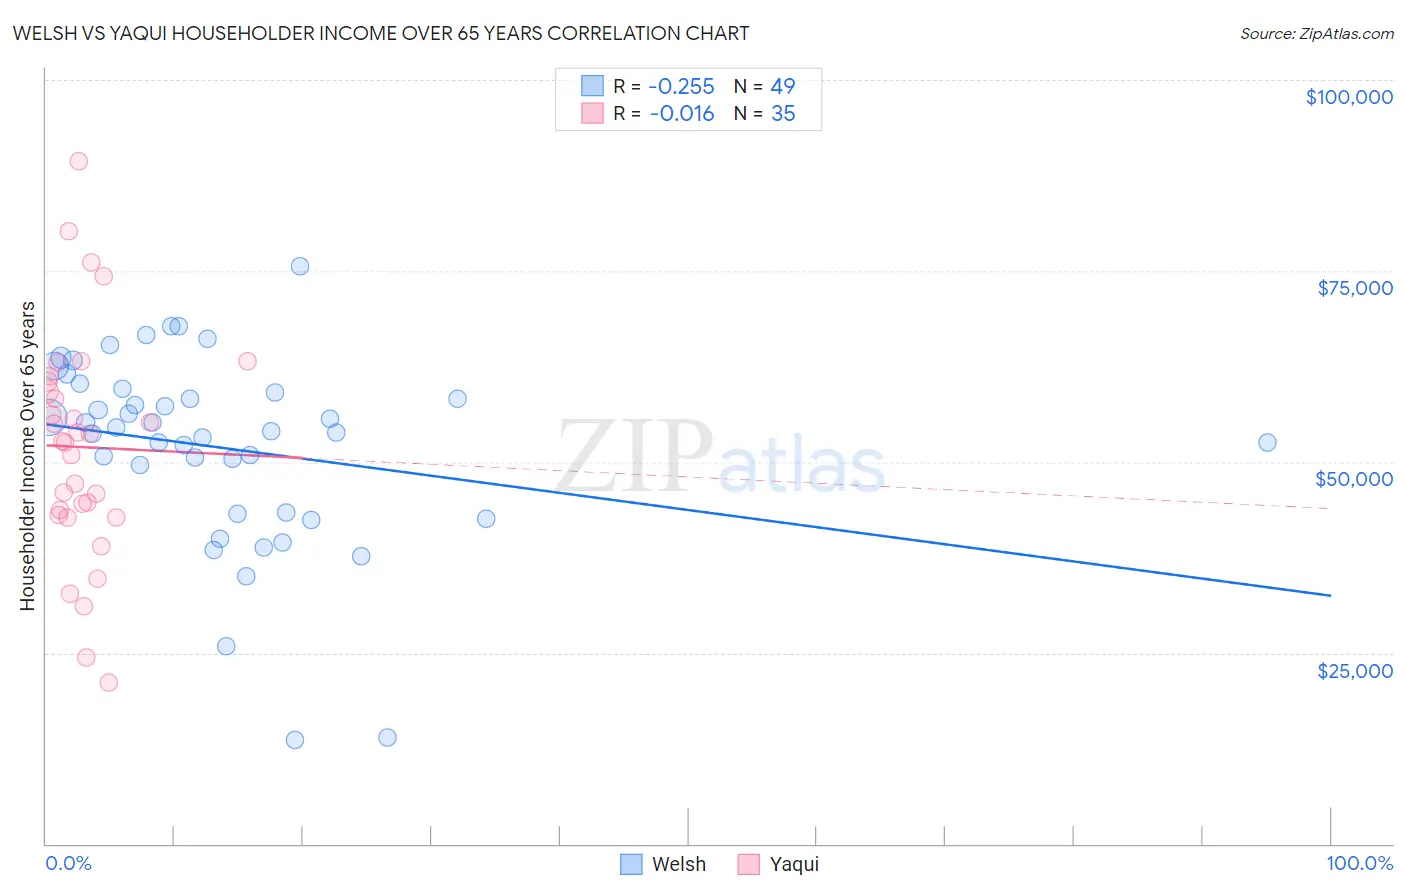
Welsh vs Yaqui Householder Income Over 65 years Correlation Chart
The statistical analysis conducted on geographies consisting of 525,240,397 people shows a weak negative correlation between the proportion of Welsh and household income with householder over the age of 65 in the United States with a correlation coefficient (R) of -0.255 and weighted average of $60,666. Similarly, the statistical analysis conducted on geographies consisting of 107,596,912 people shows no correlation between the proportion of Yaqui and household income with householder over the age of 65 in the United States with a correlation coefficient (R) of -0.016 and weighted average of $56,417, a difference of 7.5%.
Householder Income Over 65 years Correlation Summary
| Measurement | Welsh | Yaqui |
| Minimum | $13,664 | $21,164 |
| Maximum | $75,625 | $89,308 |
| Range | $61,961 | $68,144 |
| Mean | $51,794 | $51,933 |
| Median | $53,958 | $52,760 |
| Interquartile 25% (IQ1) | $43,354 | $42,965 |
| Interquartile 75% (IQ3) | $59,278 | $60,509 |
| Interquartile Range (IQR) | $15,924 | $17,544 |
| Standard Deviation (Sample) | $12,598 | $14,813 |
| Standard Deviation (Population) | $12,468 | $14,600 |
Similar Demographics by Householder Income Over 65 years
Demographics Similar to Welsh by Householder Income Over 65 years
In terms of householder income over 65 years, the demographic groups most similar to Welsh are Immigrants from Morocco ($60,647, a difference of 0.030%), Yup'ik ($60,727, a difference of 0.10%), Celtic ($60,608, a difference of 0.10%), Alaska Native ($60,748, a difference of 0.14%), and Czechoslovakian ($60,581, a difference of 0.14%).
| Demographics | Rating | Rank | Householder Income Over 65 years |
| Immigrants | Poland | 51.9 /100 | #172 | Average $61,041 |
| Immigrants | Micronesia | 50.8 /100 | #173 | Average $61,000 |
| Luxembourgers | 50.0 /100 | #174 | Average $60,967 |
| Spaniards | 47.3 /100 | #175 | Average $60,866 |
| Spanish | 45.5 /100 | #176 | Average $60,795 |
| Alaska Natives | 44.3 /100 | #177 | Average $60,748 |
| Yup'ik | 43.7 /100 | #178 | Average $60,727 |
| Welsh | 42.2 /100 | #179 | Average $60,666 |
| Immigrants | Morocco | 41.7 /100 | #180 | Average $60,647 |
| Celtics | 40.7 /100 | #181 | Average $60,608 |
| Czechoslovakians | 40.0 /100 | #182 | Average $60,581 |
| Kenyans | 38.4 /100 | #183 | Fair $60,514 |
| Iraqis | 37.2 /100 | #184 | Fair $60,466 |
| Albanians | 32.0 /100 | #185 | Fair $60,249 |
| Slovenes | 31.8 /100 | #186 | Fair $60,241 |
Demographics Similar to Yaqui by Householder Income Over 65 years
In terms of householder income over 65 years, the demographic groups most similar to Yaqui are Guyanese ($56,351, a difference of 0.12%), Immigrants from Guyana ($56,495, a difference of 0.14%), Hmong ($56,339, a difference of 0.14%), Immigrants from Uzbekistan ($56,331, a difference of 0.15%), and Central American ($56,321, a difference of 0.17%).
| Demographics | Rating | Rank | Householder Income Over 65 years |
| Spanish Americans | 1.6 /100 | #235 | Tragic $57,021 |
| Immigrants | Uruguay | 1.5 /100 | #236 | Tragic $56,975 |
| Immigrants | Panama | 1.5 /100 | #237 | Tragic $56,944 |
| Fijians | 1.2 /100 | #238 | Tragic $56,768 |
| Immigrants | Laos | 1.2 /100 | #239 | Tragic $56,722 |
| Sub-Saharan Africans | 1.0 /100 | #240 | Tragic $56,615 |
| Immigrants | Guyana | 0.9 /100 | #241 | Tragic $56,495 |
| Yaqui | 0.8 /100 | #242 | Tragic $56,417 |
| Guyanese | 0.8 /100 | #243 | Tragic $56,351 |
| Hmong | 0.8 /100 | #244 | Tragic $56,339 |
| Immigrants | Uzbekistan | 0.8 /100 | #245 | Tragic $56,331 |
| Central Americans | 0.8 /100 | #246 | Tragic $56,321 |
| Yakama | 0.7 /100 | #247 | Tragic $56,234 |
| Vietnamese | 0.6 /100 | #248 | Tragic $56,143 |
| Mexican American Indians | 0.6 /100 | #249 | Tragic $56,089 |