Vietnamese vs Delaware In Labor Force | Age > 16
COMPARE
Vietnamese
Delaware
In Labor Force | Age > 16
In Labor Force | Age > 16 Comparison
Vietnamese
Delaware
64.6%
IN LABOR FORCE | AGE > 16
4.7/ 100
METRIC RATING
234th/ 347
METRIC RANK
63.6%
IN LABOR FORCE | AGE > 16
0.0/ 100
METRIC RATING
302nd/ 347
METRIC RANK
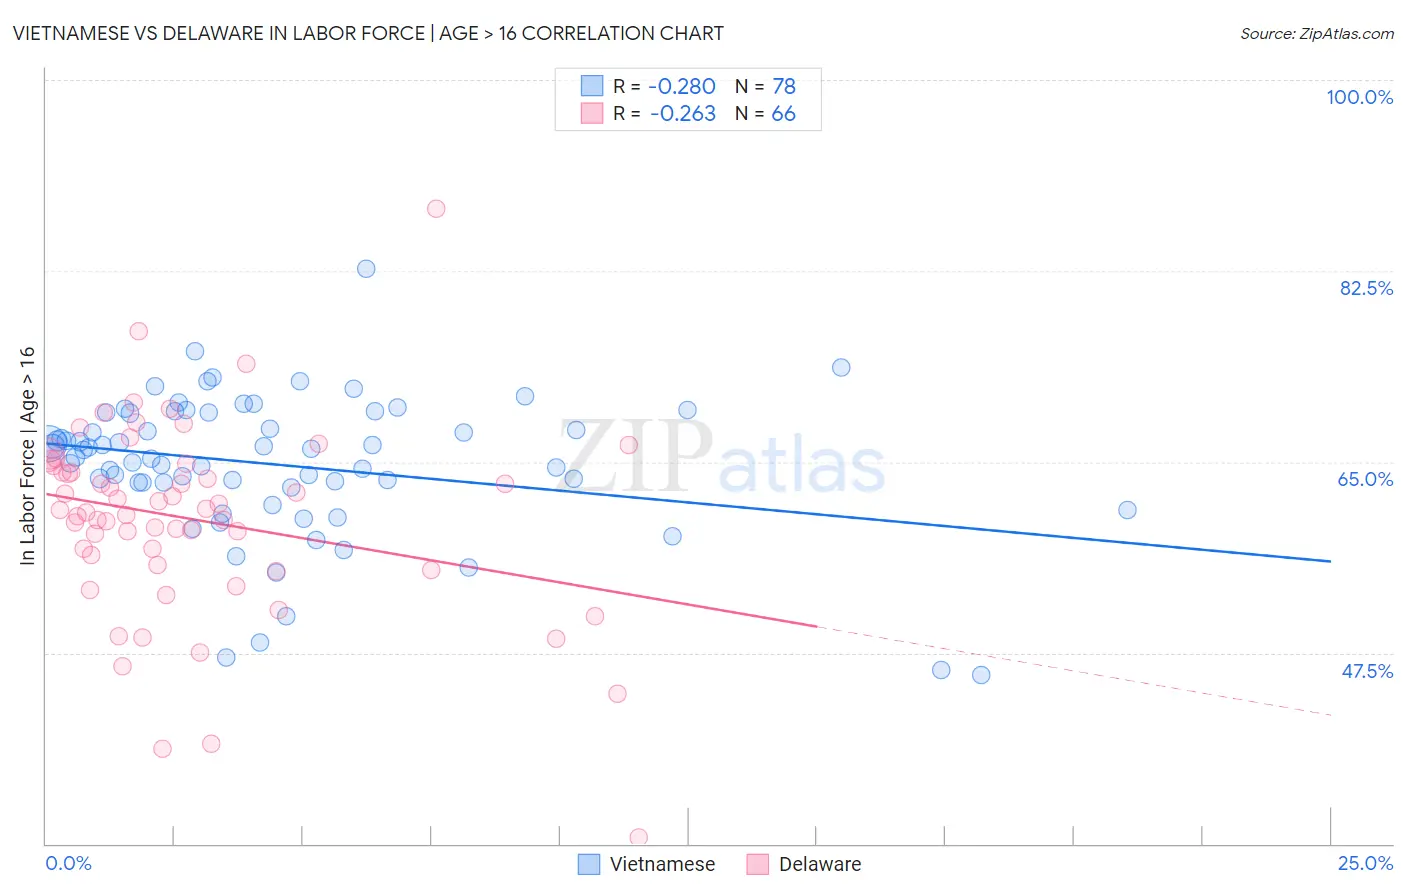
Vietnamese vs Delaware In Labor Force | Age > 16 Correlation Chart
The statistical analysis conducted on geographies consisting of 170,758,607 people shows a weak negative correlation between the proportion of Vietnamese and labor force participation rate among population ages 16 and over in the United States with a correlation coefficient (R) of -0.280 and weighted average of 64.6%. Similarly, the statistical analysis conducted on geographies consisting of 96,240,371 people shows a weak negative correlation between the proportion of Delaware and labor force participation rate among population ages 16 and over in the United States with a correlation coefficient (R) of -0.263 and weighted average of 63.6%, a difference of 1.6%.
In Labor Force | Age > 16 Correlation Summary
| Measurement | Vietnamese | Delaware |
| Minimum | 45.5% | 30.6% |
| Maximum | 82.7% | 88.2% |
| Range | 37.2% | 57.6% |
| Mean | 64.7% | 59.7% |
| Median | 65.8% | 60.5% |
| Interquartile 25% (IQ1) | 63.1% | 55.6% |
| Interquartile 75% (IQ3) | 69.5% | 64.6% |
| Interquartile Range (IQR) | 6.4% | 9.0% |
| Standard Deviation (Sample) | 6.6% | 9.0% |
| Standard Deviation (Population) | 6.5% | 9.0% |
Similar Demographics by In Labor Force | Age > 16
Demographics Similar to Vietnamese by In Labor Force | Age > 16
In terms of in labor force | age > 16, the demographic groups most similar to Vietnamese are Austrian (64.6%, a difference of 0.0%), Immigrants from Norway (64.6%, a difference of 0.0%), Italian (64.6%, a difference of 0.0%), Slavic (64.6%, a difference of 0.010%), and Lebanese (64.5%, a difference of 0.050%).
| Demographics | Rating | Rank | In Labor Force | Age > 16 |
| Poles | 8.3 /100 | #227 | Tragic 64.7% |
| Northern Europeans | 8.2 /100 | #228 | Tragic 64.7% |
| British | 7.3 /100 | #229 | Tragic 64.7% |
| Chinese | 7.3 /100 | #230 | Tragic 64.7% |
| Immigrants | Northern Europe | 7.2 /100 | #231 | Tragic 64.7% |
| Africans | 5.8 /100 | #232 | Tragic 64.6% |
| Slavs | 4.9 /100 | #233 | Tragic 64.6% |
| Vietnamese | 4.7 /100 | #234 | Tragic 64.6% |
| Austrians | 4.6 /100 | #235 | Tragic 64.6% |
| Immigrants | Norway | 4.6 /100 | #236 | Tragic 64.6% |
| Italians | 4.6 /100 | #237 | Tragic 64.6% |
| Lebanese | 3.9 /100 | #238 | Tragic 64.5% |
| Immigrants | Hungary | 3.8 /100 | #239 | Tragic 64.5% |
| Immigrants | Bangladesh | 3.6 /100 | #240 | Tragic 64.5% |
| Immigrants | Dominica | 3.5 /100 | #241 | Tragic 64.5% |
Demographics Similar to Delaware by In Labor Force | Age > 16
In terms of in labor force | age > 16, the demographic groups most similar to Delaware are Spanish American (63.6%, a difference of 0.010%), Immigrants from the Azores (63.6%, a difference of 0.040%), Cree (63.5%, a difference of 0.040%), White/Caucasian (63.6%, a difference of 0.050%), and Nonimmigrants (63.5%, a difference of 0.090%).
| Demographics | Rating | Rank | In Labor Force | Age > 16 |
| Immigrants | Canada | 0.0 /100 | #295 | Tragic 63.7% |
| Immigrants | North America | 0.0 /100 | #296 | Tragic 63.7% |
| Immigrants | Grenada | 0.0 /100 | #297 | Tragic 63.6% |
| Comanche | 0.0 /100 | #298 | Tragic 63.6% |
| Whites/Caucasians | 0.0 /100 | #299 | Tragic 63.6% |
| Immigrants | Azores | 0.0 /100 | #300 | Tragic 63.6% |
| Spanish Americans | 0.0 /100 | #301 | Tragic 63.6% |
| Delaware | 0.0 /100 | #302 | Tragic 63.6% |
| Cree | 0.0 /100 | #303 | Tragic 63.5% |
| Immigrants | Nonimmigrants | 0.0 /100 | #304 | Tragic 63.5% |
| Osage | 0.0 /100 | #305 | Tragic 63.5% |
| Blacks/African Americans | 0.0 /100 | #306 | Tragic 63.4% |
| Central American Indians | 0.0 /100 | #307 | Tragic 63.4% |
| Pennsylvania Germans | 0.0 /100 | #308 | Tragic 63.4% |
| Scotch-Irish | 0.0 /100 | #309 | Tragic 63.3% |