Vietnamese vs African Births to Unmarried Women
COMPARE
Vietnamese
African
Births to Unmarried Women
Births to Unmarried Women Comparison
Vietnamese
Africans
30.2%
BIRTHS TO UNMARRIED WOMEN
87.7/ 100
METRIC RATING
125th/ 347
METRIC RANK
39.7%
BIRTHS TO UNMARRIED WOMEN
0.0/ 100
METRIC RATING
313th/ 347
METRIC RANK
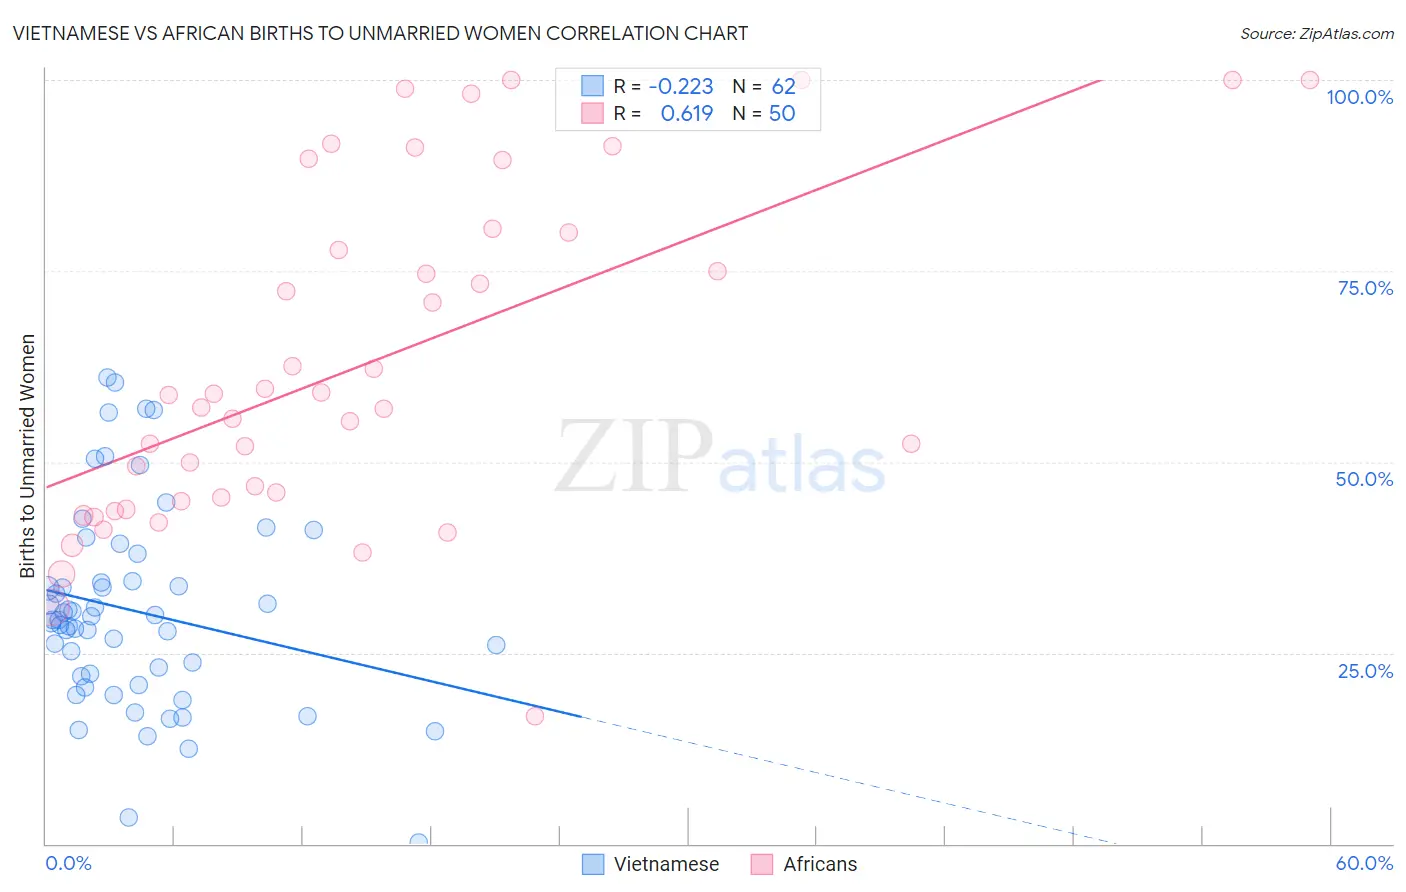
Vietnamese vs African Births to Unmarried Women Correlation Chart
The statistical analysis conducted on geographies consisting of 164,695,989 people shows a weak negative correlation between the proportion of Vietnamese and percentage of births to unmarried women in the United States with a correlation coefficient (R) of -0.223 and weighted average of 30.2%. Similarly, the statistical analysis conducted on geographies consisting of 441,094,668 people shows a significant positive correlation between the proportion of Africans and percentage of births to unmarried women in the United States with a correlation coefficient (R) of 0.619 and weighted average of 39.7%, a difference of 31.5%.
Births to Unmarried Women Correlation Summary
| Measurement | Vietnamese | African |
| Minimum | 0.20% | 16.7% |
| Maximum | 61.1% | 100.0% |
| Range | 60.9% | 83.3% |
| Mean | 30.5% | 62.7% |
| Median | 29.3% | 58.0% |
| Interquartile 25% (IQ1) | 22.0% | 44.9% |
| Interquartile 75% (IQ3) | 34.3% | 80.0% |
| Interquartile Range (IQR) | 12.3% | 35.1% |
| Standard Deviation (Sample) | 13.0% | 21.9% |
| Standard Deviation (Population) | 12.9% | 21.6% |
Similar Demographics by Births to Unmarried Women
Demographics Similar to Vietnamese by Births to Unmarried Women
In terms of births to unmarried women, the demographic groups most similar to Vietnamese are Croatian (30.2%, a difference of 0.070%), Syrian (30.2%, a difference of 0.11%), European (30.2%, a difference of 0.12%), Chinese (30.2%, a difference of 0.14%), and Immigrants from Argentina (30.1%, a difference of 0.24%).
| Demographics | Rating | Rank | Births to Unmarried Women |
| Immigrants | Norway | 91.0 /100 | #118 | Exceptional 29.9% |
| Argentineans | 90.5 /100 | #119 | Exceptional 30.0% |
| Ugandans | 89.2 /100 | #120 | Excellent 30.1% |
| Koreans | 88.9 /100 | #121 | Excellent 30.1% |
| Immigrants | Argentina | 88.7 /100 | #122 | Excellent 30.1% |
| Syrians | 88.2 /100 | #123 | Excellent 30.2% |
| Croatians | 88.0 /100 | #124 | Excellent 30.2% |
| Vietnamese | 87.7 /100 | #125 | Excellent 30.2% |
| Europeans | 87.2 /100 | #126 | Excellent 30.2% |
| Chinese | 87.1 /100 | #127 | Excellent 30.2% |
| Icelanders | 86.0 /100 | #128 | Excellent 30.3% |
| Immigrants | Spain | 85.8 /100 | #129 | Excellent 30.3% |
| Immigrants | Bosnia and Herzegovina | 85.7 /100 | #130 | Excellent 30.3% |
| Immigrants | Zimbabwe | 85.7 /100 | #131 | Excellent 30.3% |
| New Zealanders | 85.5 /100 | #132 | Excellent 30.3% |
Demographics Similar to Africans by Births to Unmarried Women
In terms of births to unmarried women, the demographic groups most similar to Africans are Immigrants from Caribbean (39.8%, a difference of 0.29%), Dominican (39.8%, a difference of 0.33%), U.S. Virgin Islander (39.6%, a difference of 0.34%), Immigrants from the Azores (39.6%, a difference of 0.36%), and Apache (39.9%, a difference of 0.38%).
| Demographics | Rating | Rank | Births to Unmarried Women |
| Central American Indians | 0.0 /100 | #306 | Tragic 39.0% |
| Immigrants | Honduras | 0.0 /100 | #307 | Tragic 39.3% |
| Aleuts | 0.0 /100 | #308 | Tragic 39.3% |
| Cubans | 0.0 /100 | #309 | Tragic 39.4% |
| Immigrants | Dominica | 0.0 /100 | #310 | Tragic 39.5% |
| Immigrants | Azores | 0.0 /100 | #311 | Tragic 39.6% |
| U.S. Virgin Islanders | 0.0 /100 | #312 | Tragic 39.6% |
| Africans | 0.0 /100 | #313 | Tragic 39.7% |
| Immigrants | Caribbean | 0.0 /100 | #314 | Tragic 39.8% |
| Dominicans | 0.0 /100 | #315 | Tragic 39.8% |
| Apache | 0.0 /100 | #316 | Tragic 39.9% |
| Immigrants | Dominican Republic | 0.0 /100 | #317 | Tragic 40.1% |
| Immigrants | Bahamas | 0.0 /100 | #318 | Tragic 40.1% |
| Yakama | 0.0 /100 | #319 | Tragic 40.3% |
| Crow | 0.0 /100 | #320 | Tragic 40.4% |