Vietnamese vs Irish In Labor Force | Age > 16
COMPARE
Vietnamese
Irish
In Labor Force | Age > 16
In Labor Force | Age > 16 Comparison
Vietnamese
Irish
64.6%
IN LABOR FORCE | AGE > 16
4.7/ 100
METRIC RATING
234th/ 347
METRIC RANK
64.1%
IN LABOR FORCE | AGE > 16
0.4/ 100
METRIC RATING
269th/ 347
METRIC RANK
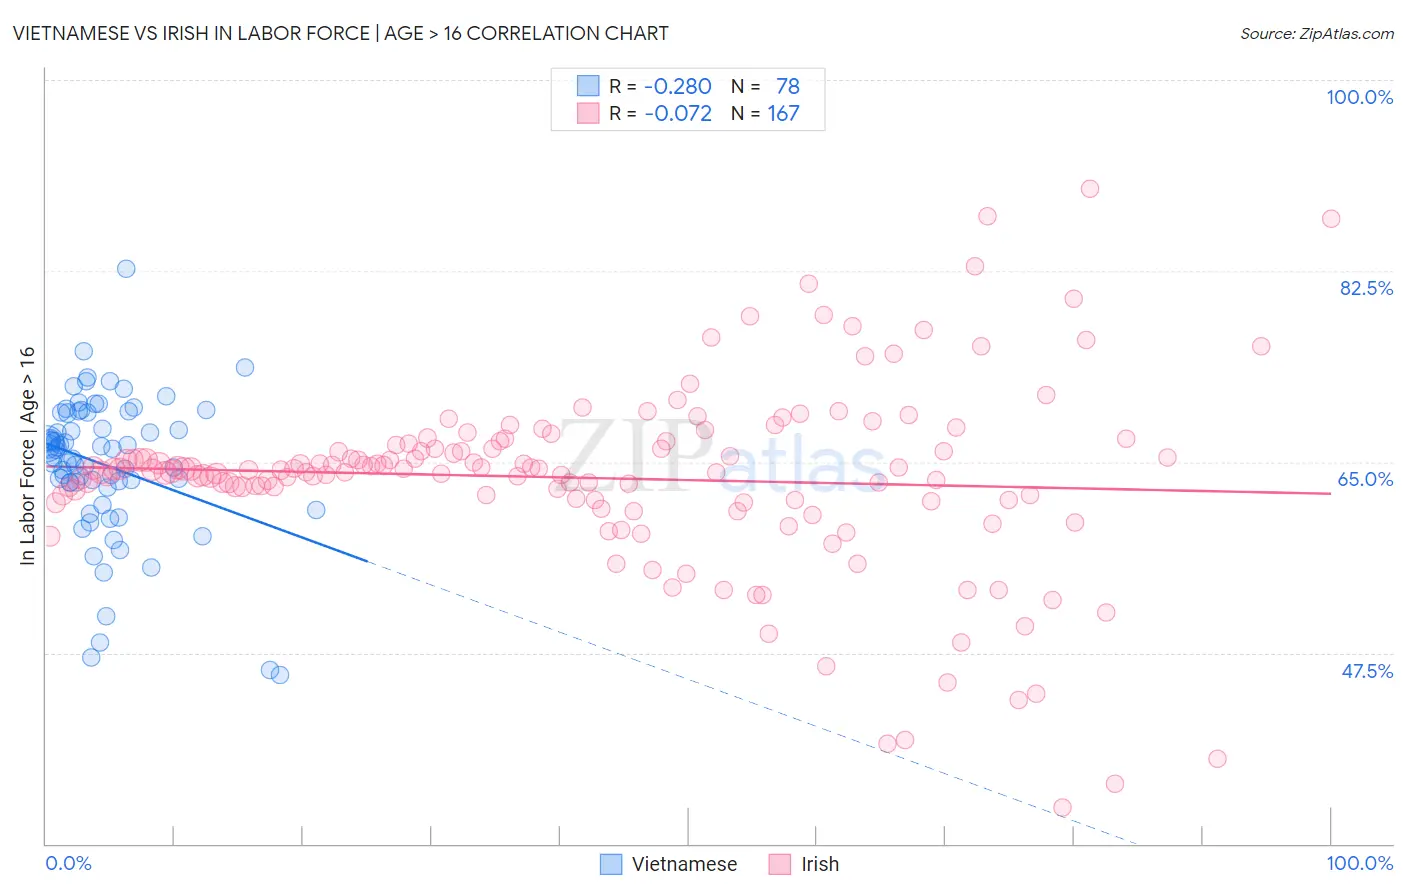
Vietnamese vs Irish In Labor Force | Age > 16 Correlation Chart
The statistical analysis conducted on geographies consisting of 170,758,607 people shows a weak negative correlation between the proportion of Vietnamese and labor force participation rate among population ages 16 and over in the United States with a correlation coefficient (R) of -0.280 and weighted average of 64.6%. Similarly, the statistical analysis conducted on geographies consisting of 580,699,794 people shows a slight negative correlation between the proportion of Irish and labor force participation rate among population ages 16 and over in the United States with a correlation coefficient (R) of -0.072 and weighted average of 64.1%, a difference of 0.70%.
In Labor Force | Age > 16 Correlation Summary
| Measurement | Vietnamese | Irish |
| Minimum | 45.5% | 33.3% |
| Maximum | 82.7% | 90.0% |
| Range | 37.2% | 56.7% |
| Mean | 64.7% | 63.5% |
| Median | 65.8% | 64.3% |
| Interquartile 25% (IQ1) | 63.1% | 61.5% |
| Interquartile 75% (IQ3) | 69.5% | 66.6% |
| Interquartile Range (IQR) | 6.4% | 5.1% |
| Standard Deviation (Sample) | 6.6% | 8.6% |
| Standard Deviation (Population) | 6.5% | 8.6% |
Similar Demographics by In Labor Force | Age > 16
Demographics Similar to Vietnamese by In Labor Force | Age > 16
In terms of in labor force | age > 16, the demographic groups most similar to Vietnamese are Austrian (64.6%, a difference of 0.0%), Immigrants from Norway (64.6%, a difference of 0.0%), Italian (64.6%, a difference of 0.0%), Slavic (64.6%, a difference of 0.010%), and Lebanese (64.5%, a difference of 0.050%).
| Demographics | Rating | Rank | In Labor Force | Age > 16 |
| Poles | 8.3 /100 | #227 | Tragic 64.7% |
| Northern Europeans | 8.2 /100 | #228 | Tragic 64.7% |
| British | 7.3 /100 | #229 | Tragic 64.7% |
| Chinese | 7.3 /100 | #230 | Tragic 64.7% |
| Immigrants | Northern Europe | 7.2 /100 | #231 | Tragic 64.7% |
| Africans | 5.8 /100 | #232 | Tragic 64.6% |
| Slavs | 4.9 /100 | #233 | Tragic 64.6% |
| Vietnamese | 4.7 /100 | #234 | Tragic 64.6% |
| Austrians | 4.6 /100 | #235 | Tragic 64.6% |
| Immigrants | Norway | 4.6 /100 | #236 | Tragic 64.6% |
| Italians | 4.6 /100 | #237 | Tragic 64.6% |
| Lebanese | 3.9 /100 | #238 | Tragic 64.5% |
| Immigrants | Hungary | 3.8 /100 | #239 | Tragic 64.5% |
| Immigrants | Bangladesh | 3.6 /100 | #240 | Tragic 64.5% |
| Immigrants | Dominica | 3.5 /100 | #241 | Tragic 64.5% |
Demographics Similar to Irish by In Labor Force | Age > 16
In terms of in labor force | age > 16, the demographic groups most similar to Irish are Guyanese (64.1%, a difference of 0.030%), Dominican (64.1%, a difference of 0.030%), Canadian (64.1%, a difference of 0.040%), Spaniard (64.1%, a difference of 0.040%), and Immigrants from England (64.2%, a difference of 0.050%).
| Demographics | Rating | Rank | In Labor Force | Age > 16 |
| Finns | 0.7 /100 | #262 | Tragic 64.2% |
| Bahamians | 0.6 /100 | #263 | Tragic 64.2% |
| Dutch | 0.6 /100 | #264 | Tragic 64.2% |
| Cubans | 0.5 /100 | #265 | Tragic 64.2% |
| Immigrants | England | 0.5 /100 | #266 | Tragic 64.2% |
| Canadians | 0.5 /100 | #267 | Tragic 64.1% |
| Spaniards | 0.5 /100 | #268 | Tragic 64.1% |
| Irish | 0.4 /100 | #269 | Tragic 64.1% |
| Guyanese | 0.4 /100 | #270 | Tragic 64.1% |
| Dominicans | 0.4 /100 | #271 | Tragic 64.1% |
| Native Hawaiians | 0.3 /100 | #272 | Tragic 64.1% |
| Hmong | 0.3 /100 | #273 | Tragic 64.1% |
| Immigrants | Cuba | 0.3 /100 | #274 | Tragic 64.1% |
| Mexicans | 0.3 /100 | #275 | Tragic 64.1% |
| French American Indians | 0.3 /100 | #276 | Tragic 64.1% |