Honduran vs Tongan In Labor Force | Age > 16
COMPARE
Honduran
Tongan
In Labor Force | Age > 16
In Labor Force | Age > 16 Comparison
Hondurans
Tongans
65.8%
IN LABOR FORCE | AGE > 16
97.1/ 100
METRIC RATING
114th/ 347
METRIC RANK
67.5%
IN LABOR FORCE | AGE > 16
100.0/ 100
METRIC RATING
21st/ 347
METRIC RANK
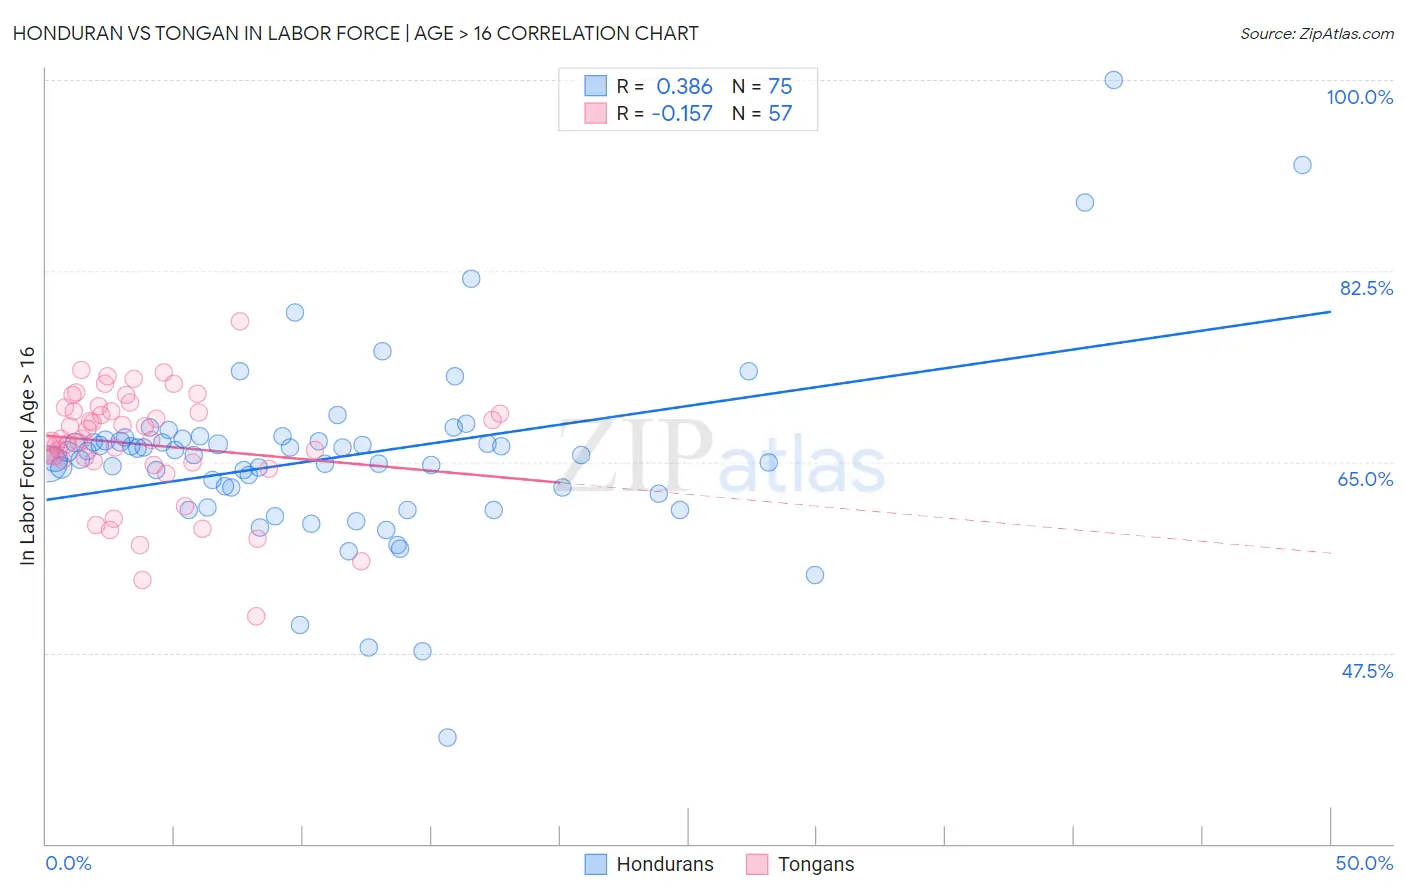
Honduran vs Tongan In Labor Force | Age > 16 Correlation Chart
The statistical analysis conducted on geographies consisting of 357,848,519 people shows a mild positive correlation between the proportion of Hondurans and labor force participation rate among population ages 16 and over in the United States with a correlation coefficient (R) of 0.386 and weighted average of 65.8%. Similarly, the statistical analysis conducted on geographies consisting of 102,905,644 people shows a poor negative correlation between the proportion of Tongans and labor force participation rate among population ages 16 and over in the United States with a correlation coefficient (R) of -0.157 and weighted average of 67.5%, a difference of 2.7%.
In Labor Force | Age > 16 Correlation Summary
| Measurement | Honduran | Tongan |
| Minimum | 39.7% | 50.8% |
| Maximum | 100.0% | 77.9% |
| Range | 60.3% | 27.1% |
| Mean | 65.4% | 66.6% |
| Median | 65.7% | 67.1% |
| Interquartile 25% (IQ1) | 62.1% | 65.0% |
| Interquartile 75% (IQ3) | 67.0% | 69.8% |
| Interquartile Range (IQR) | 4.9% | 4.8% |
| Standard Deviation (Sample) | 8.6% | 5.2% |
| Standard Deviation (Population) | 8.5% | 5.1% |
Similar Demographics by In Labor Force | Age > 16
Demographics Similar to Hondurans by In Labor Force | Age > 16
In terms of in labor force | age > 16, the demographic groups most similar to Hondurans are Pakistani (65.8%, a difference of 0.010%), Laotian (65.8%, a difference of 0.030%), Immigrants from Indonesia (65.7%, a difference of 0.030%), Argentinean (65.7%, a difference of 0.040%), and Immigrants from Iran (65.7%, a difference of 0.040%).
| Demographics | Rating | Rank | In Labor Force | Age > 16 |
| Immigrants | Poland | 98.1 /100 | #107 | Exceptional 65.8% |
| Immigrants | Spain | 98.0 /100 | #108 | Exceptional 65.8% |
| Immigrants | Japan | 98.0 /100 | #109 | Exceptional 65.8% |
| Japanese | 97.7 /100 | #110 | Exceptional 65.8% |
| Immigrants | Honduras | 97.5 /100 | #111 | Exceptional 65.8% |
| Laotians | 97.4 /100 | #112 | Exceptional 65.8% |
| Pakistanis | 97.1 /100 | #113 | Exceptional 65.8% |
| Hondurans | 97.1 /100 | #114 | Exceptional 65.8% |
| Immigrants | Indonesia | 96.8 /100 | #115 | Exceptional 65.7% |
| Argentineans | 96.7 /100 | #116 | Exceptional 65.7% |
| Immigrants | Iran | 96.6 /100 | #117 | Exceptional 65.7% |
| Immigrants | Thailand | 96.6 /100 | #118 | Exceptional 65.7% |
| Immigrants | France | 96.4 /100 | #119 | Exceptional 65.7% |
| Immigrants | Hong Kong | 96.2 /100 | #120 | Exceptional 65.7% |
| New Zealanders | 96.0 /100 | #121 | Exceptional 65.7% |
Demographics Similar to Tongans by In Labor Force | Age > 16
In terms of in labor force | age > 16, the demographic groups most similar to Tongans are Immigrants from Kenya (67.6%, a difference of 0.020%), Immigrants from Uganda (67.5%, a difference of 0.060%), Kenyan (67.6%, a difference of 0.070%), Immigrants from Liberia (67.6%, a difference of 0.10%), and Immigrants from India (67.6%, a difference of 0.12%).
| Demographics | Rating | Rank | In Labor Force | Age > 16 |
| Liberians | 100.0 /100 | #14 | Exceptional 67.8% |
| Immigrants | Middle Africa | 100.0 /100 | #15 | Exceptional 67.7% |
| Immigrants | Sudan | 100.0 /100 | #16 | Exceptional 67.7% |
| Immigrants | India | 100.0 /100 | #17 | Exceptional 67.6% |
| Immigrants | Liberia | 100.0 /100 | #18 | Exceptional 67.6% |
| Kenyans | 100.0 /100 | #19 | Exceptional 67.6% |
| Immigrants | Kenya | 100.0 /100 | #20 | Exceptional 67.6% |
| Tongans | 100.0 /100 | #21 | Exceptional 67.5% |
| Immigrants | Uganda | 100.0 /100 | #22 | Exceptional 67.5% |
| Cambodians | 100.0 /100 | #23 | Exceptional 67.4% |
| Ugandans | 100.0 /100 | #24 | Exceptional 67.4% |
| Immigrants | Africa | 100.0 /100 | #25 | Exceptional 67.4% |
| Immigrants | Cabo Verde | 100.0 /100 | #26 | Exceptional 67.3% |
| Zimbabweans | 100.0 /100 | #27 | Exceptional 67.3% |
| Immigrants | Morocco | 100.0 /100 | #28 | Exceptional 67.2% |