Immigrants from Malaysia vs Tongan In Labor Force | Age > 16
COMPARE
Immigrants from Malaysia
Tongan
In Labor Force | Age > 16
In Labor Force | Age > 16 Comparison
Immigrants from Malaysia
Tongans
66.1%
IN LABOR FORCE | AGE > 16
99.6/ 100
METRIC RATING
76th/ 347
METRIC RANK
67.5%
IN LABOR FORCE | AGE > 16
100.0/ 100
METRIC RATING
21st/ 347
METRIC RANK
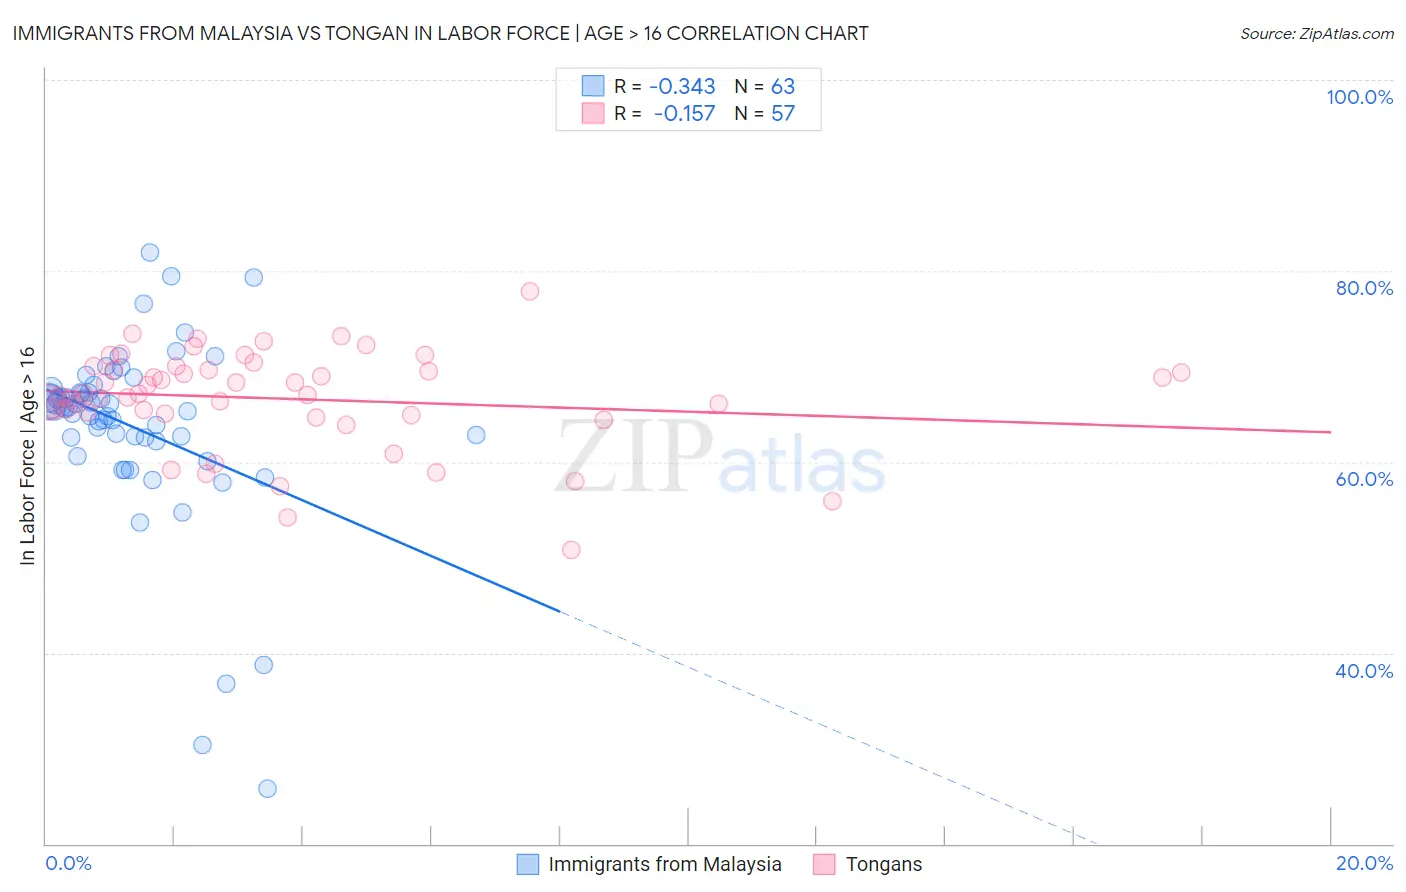
Immigrants from Malaysia vs Tongan In Labor Force | Age > 16 Correlation Chart
The statistical analysis conducted on geographies consisting of 197,973,684 people shows a mild negative correlation between the proportion of Immigrants from Malaysia and labor force participation rate among population ages 16 and over in the United States with a correlation coefficient (R) of -0.343 and weighted average of 66.1%. Similarly, the statistical analysis conducted on geographies consisting of 102,905,644 people shows a poor negative correlation between the proportion of Tongans and labor force participation rate among population ages 16 and over in the United States with a correlation coefficient (R) of -0.157 and weighted average of 67.5%, a difference of 2.1%.
In Labor Force | Age > 16 Correlation Summary
| Measurement | Immigrants from Malaysia | Tongan |
| Minimum | 25.8% | 50.8% |
| Maximum | 81.9% | 77.9% |
| Range | 56.1% | 27.1% |
| Mean | 63.7% | 66.6% |
| Median | 65.7% | 67.1% |
| Interquartile 25% (IQ1) | 62.5% | 65.0% |
| Interquartile 75% (IQ3) | 67.3% | 69.8% |
| Interquartile Range (IQR) | 4.8% | 4.8% |
| Standard Deviation (Sample) | 9.7% | 5.2% |
| Standard Deviation (Population) | 9.6% | 5.1% |
Similar Demographics by In Labor Force | Age > 16
Demographics Similar to Immigrants from Malaysia by In Labor Force | Age > 16
In terms of in labor force | age > 16, the demographic groups most similar to Immigrants from Malaysia are Immigrants from Moldova (66.1%, a difference of 0.010%), Immigrants from Asia (66.1%, a difference of 0.010%), Turkish (66.1%, a difference of 0.040%), Immigrants from Singapore (66.2%, a difference of 0.050%), and Malaysian (66.1%, a difference of 0.050%).
| Demographics | Rating | Rank | In Labor Force | Age > 16 |
| Sub-Saharan Africans | 99.7 /100 | #69 | Exceptional 66.2% |
| Asians | 99.7 /100 | #70 | Exceptional 66.2% |
| Burmese | 99.7 /100 | #71 | Exceptional 66.2% |
| Taiwanese | 99.7 /100 | #72 | Exceptional 66.2% |
| Immigrants | Vietnam | 99.7 /100 | #73 | Exceptional 66.2% |
| Immigrants | Korea | 99.7 /100 | #74 | Exceptional 66.2% |
| Immigrants | Singapore | 99.7 /100 | #75 | Exceptional 66.2% |
| Immigrants | Malaysia | 99.6 /100 | #76 | Exceptional 66.1% |
| Immigrants | Moldova | 99.6 /100 | #77 | Exceptional 66.1% |
| Immigrants | Asia | 99.6 /100 | #78 | Exceptional 66.1% |
| Turks | 99.6 /100 | #79 | Exceptional 66.1% |
| Malaysians | 99.6 /100 | #80 | Exceptional 66.1% |
| Moroccans | 99.5 /100 | #81 | Exceptional 66.1% |
| German Russians | 99.4 /100 | #82 | Exceptional 66.1% |
| Immigrants | Jordan | 99.4 /100 | #83 | Exceptional 66.1% |
Demographics Similar to Tongans by In Labor Force | Age > 16
In terms of in labor force | age > 16, the demographic groups most similar to Tongans are Immigrants from Kenya (67.6%, a difference of 0.020%), Immigrants from Uganda (67.5%, a difference of 0.060%), Kenyan (67.6%, a difference of 0.070%), Immigrants from Liberia (67.6%, a difference of 0.10%), and Immigrants from India (67.6%, a difference of 0.12%).
| Demographics | Rating | Rank | In Labor Force | Age > 16 |
| Liberians | 100.0 /100 | #14 | Exceptional 67.8% |
| Immigrants | Middle Africa | 100.0 /100 | #15 | Exceptional 67.7% |
| Immigrants | Sudan | 100.0 /100 | #16 | Exceptional 67.7% |
| Immigrants | India | 100.0 /100 | #17 | Exceptional 67.6% |
| Immigrants | Liberia | 100.0 /100 | #18 | Exceptional 67.6% |
| Kenyans | 100.0 /100 | #19 | Exceptional 67.6% |
| Immigrants | Kenya | 100.0 /100 | #20 | Exceptional 67.6% |
| Tongans | 100.0 /100 | #21 | Exceptional 67.5% |
| Immigrants | Uganda | 100.0 /100 | #22 | Exceptional 67.5% |
| Cambodians | 100.0 /100 | #23 | Exceptional 67.4% |
| Ugandans | 100.0 /100 | #24 | Exceptional 67.4% |
| Immigrants | Africa | 100.0 /100 | #25 | Exceptional 67.4% |
| Immigrants | Cabo Verde | 100.0 /100 | #26 | Exceptional 67.3% |
| Zimbabweans | 100.0 /100 | #27 | Exceptional 67.3% |
| Immigrants | Morocco | 100.0 /100 | #28 | Exceptional 67.2% |