Belizean vs Somali In Labor Force | Age > 16
COMPARE
Belizean
Somali
In Labor Force | Age > 16
In Labor Force | Age > 16 Comparison
Belizeans
Somalis
64.8%
IN LABOR FORCE | AGE > 16
16.2/ 100
METRIC RATING
208th/ 347
METRIC RANK
69.2%
IN LABOR FORCE | AGE > 16
100.0/ 100
METRIC RATING
3rd/ 347
METRIC RANK
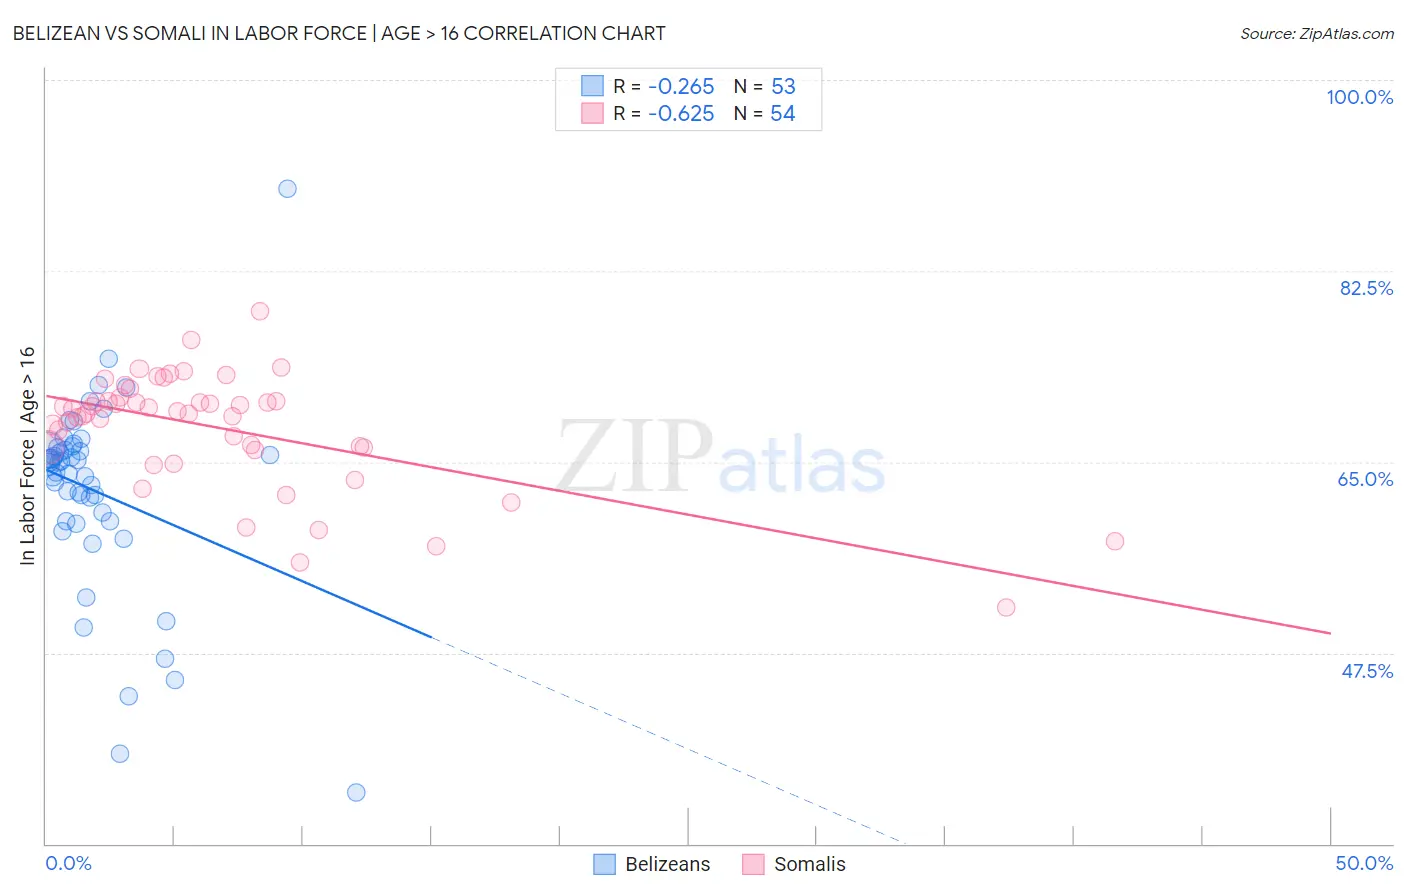
Belizean vs Somali In Labor Force | Age > 16 Correlation Chart
The statistical analysis conducted on geographies consisting of 144,214,233 people shows a weak negative correlation between the proportion of Belizeans and labor force participation rate among population ages 16 and over in the United States with a correlation coefficient (R) of -0.265 and weighted average of 64.8%. Similarly, the statistical analysis conducted on geographies consisting of 99,331,399 people shows a significant negative correlation between the proportion of Somalis and labor force participation rate among population ages 16 and over in the United States with a correlation coefficient (R) of -0.625 and weighted average of 69.2%, a difference of 6.7%.
In Labor Force | Age > 16 Correlation Summary
| Measurement | Belizean | Somali |
| Minimum | 34.7% | 51.7% |
| Maximum | 90.0% | 78.8% |
| Range | 55.3% | 27.1% |
| Mean | 62.3% | 68.1% |
| Median | 64.7% | 69.5% |
| Interquartile 25% (IQ1) | 59.6% | 66.3% |
| Interquartile 75% (IQ3) | 66.2% | 70.6% |
| Interquartile Range (IQR) | 6.6% | 4.3% |
| Standard Deviation (Sample) | 9.1% | 5.3% |
| Standard Deviation (Population) | 9.0% | 5.2% |
Similar Demographics by In Labor Force | Age > 16
Demographics Similar to Belizeans by In Labor Force | Age > 16
In terms of in labor force | age > 16, the demographic groups most similar to Belizeans are Immigrants from Latin America (64.8%, a difference of 0.010%), Immigrants from Trinidad and Tobago (64.8%, a difference of 0.010%), Lithuanian (64.8%, a difference of 0.020%), Immigrants from Denmark (64.8%, a difference of 0.030%), and Fijian (64.8%, a difference of 0.040%).
| Demographics | Rating | Rank | In Labor Force | Age > 16 |
| Ukrainians | 19.6 /100 | #201 | Poor 64.9% |
| Immigrants | Belgium | 19.4 /100 | #202 | Poor 64.9% |
| Russians | 18.8 /100 | #203 | Poor 64.9% |
| Slovenes | 18.7 /100 | #204 | Poor 64.9% |
| Jamaicans | 18.7 /100 | #205 | Poor 64.9% |
| Lithuanians | 17.4 /100 | #206 | Poor 64.8% |
| Immigrants | Latin America | 16.4 /100 | #207 | Poor 64.8% |
| Belizeans | 16.2 /100 | #208 | Poor 64.8% |
| Immigrants | Trinidad and Tobago | 15.6 /100 | #209 | Poor 64.8% |
| Immigrants | Denmark | 14.7 /100 | #210 | Poor 64.8% |
| Fijians | 14.1 /100 | #211 | Poor 64.8% |
| Alaskan Athabascans | 13.9 /100 | #212 | Poor 64.8% |
| Maltese | 13.8 /100 | #213 | Poor 64.8% |
| Estonians | 13.1 /100 | #214 | Poor 64.8% |
| Immigrants | Czechoslovakia | 12.3 /100 | #215 | Poor 64.8% |
Demographics Similar to Somalis by In Labor Force | Age > 16
In terms of in labor force | age > 16, the demographic groups most similar to Somalis are Immigrants from Somalia (69.1%, a difference of 0.070%), Ethiopian (69.3%, a difference of 0.20%), Immigrants from Ethiopia (69.4%, a difference of 0.36%), Sierra Leonean (68.9%, a difference of 0.38%), and Immigrants from Eritrea (68.9%, a difference of 0.43%).
| Demographics | Rating | Rank | In Labor Force | Age > 16 |
| Immigrants | Ethiopia | 100.0 /100 | #1 | Exceptional 69.4% |
| Ethiopians | 100.0 /100 | #2 | Exceptional 69.3% |
| Somalis | 100.0 /100 | #3 | Exceptional 69.2% |
| Immigrants | Somalia | 100.0 /100 | #4 | Exceptional 69.1% |
| Sierra Leoneans | 100.0 /100 | #5 | Exceptional 68.9% |
| Immigrants | Eritrea | 100.0 /100 | #6 | Exceptional 68.9% |
| Immigrants | Cameroon | 100.0 /100 | #7 | Exceptional 68.7% |
| Immigrants | Sierra Leone | 100.0 /100 | #8 | Exceptional 68.5% |
| Immigrants | Eastern Africa | 100.0 /100 | #9 | Exceptional 68.5% |
| Immigrants | Bolivia | 100.0 /100 | #10 | Exceptional 68.4% |
| Bolivians | 100.0 /100 | #11 | Exceptional 68.2% |
| Sudanese | 100.0 /100 | #12 | Exceptional 68.0% |
| Immigrants | Nepal | 100.0 /100 | #13 | Exceptional 68.0% |
| Liberians | 100.0 /100 | #14 | Exceptional 67.8% |
| Immigrants | Middle Africa | 100.0 /100 | #15 | Exceptional 67.7% |