Ugandan vs Paiute Professional Degree
COMPARE
Ugandan
Paiute
Professional Degree
Professional Degree Comparison
Ugandans
Paiute
5.1%
PROFESSIONAL DEGREE
98.8/ 100
METRIC RATING
100th/ 347
METRIC RANK
3.4%
PROFESSIONAL DEGREE
0.3/ 100
METRIC RATING
294th/ 347
METRIC RANK
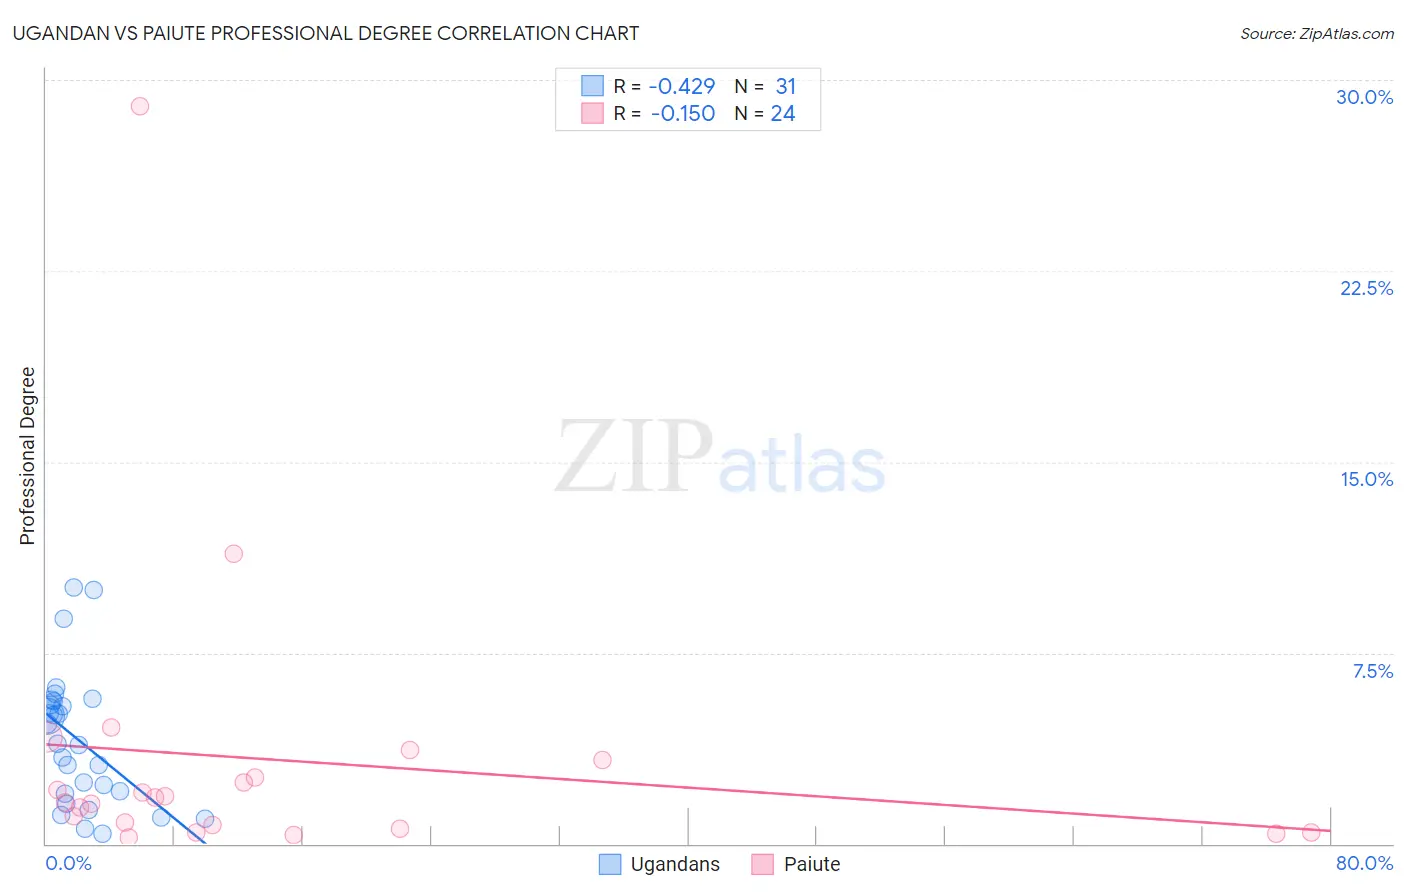
Ugandan vs Paiute Professional Degree Correlation Chart
The statistical analysis conducted on geographies consisting of 93,981,800 people shows a moderate negative correlation between the proportion of Ugandans and percentage of population with at least professional degree education in the United States with a correlation coefficient (R) of -0.429 and weighted average of 5.1%. Similarly, the statistical analysis conducted on geographies consisting of 58,323,381 people shows a poor negative correlation between the proportion of Paiute and percentage of population with at least professional degree education in the United States with a correlation coefficient (R) of -0.150 and weighted average of 3.4%, a difference of 48.3%.
Professional Degree Correlation Summary
| Measurement | Ugandan | Paiute |
| Minimum | 0.38% | 0.27% |
| Maximum | 10.1% | 29.0% |
| Range | 9.7% | 28.7% |
| Mean | 4.1% | 3.3% |
| Median | 3.9% | 1.7% |
| Interquartile 25% (IQ1) | 2.0% | 0.65% |
| Interquartile 75% (IQ3) | 5.6% | 2.9% |
| Interquartile Range (IQR) | 3.6% | 2.3% |
| Standard Deviation (Sample) | 2.6% | 5.9% |
| Standard Deviation (Population) | 2.5% | 5.8% |
Similar Demographics by Professional Degree
Demographics Similar to Ugandans by Professional Degree
In terms of professional degree, the demographic groups most similar to Ugandans are Immigrants from Egypt (5.1%, a difference of 0.75%), Immigrants from Italy (5.2%, a difference of 0.76%), Austrian (5.2%, a difference of 0.82%), Ukrainian (5.1%, a difference of 0.83%), and Syrian (5.2%, a difference of 0.85%).
| Demographics | Rating | Rank | Professional Degree |
| Northern Europeans | 99.3 /100 | #93 | Exceptional 5.2% |
| Alsatians | 99.3 /100 | #94 | Exceptional 5.2% |
| Zimbabweans | 99.3 /100 | #95 | Exceptional 5.2% |
| Immigrants | Uzbekistan | 99.2 /100 | #96 | Exceptional 5.2% |
| Syrians | 99.1 /100 | #97 | Exceptional 5.2% |
| Austrians | 99.1 /100 | #98 | Exceptional 5.2% |
| Immigrants | Italy | 99.1 /100 | #99 | Exceptional 5.2% |
| Ugandans | 98.8 /100 | #100 | Exceptional 5.1% |
| Immigrants | Egypt | 98.5 /100 | #101 | Exceptional 5.1% |
| Ukrainians | 98.5 /100 | #102 | Exceptional 5.1% |
| Immigrants | Northern Africa | 98.4 /100 | #103 | Exceptional 5.1% |
| Arabs | 98.2 /100 | #104 | Exceptional 5.0% |
| Immigrants | Uganda | 98.2 /100 | #105 | Exceptional 5.0% |
| Immigrants | Ukraine | 98.2 /100 | #106 | Exceptional 5.0% |
| Maltese | 98.1 /100 | #107 | Exceptional 5.0% |
Demographics Similar to Paiute by Professional Degree
In terms of professional degree, the demographic groups most similar to Paiute are Immigrants from Honduras (3.5%, a difference of 0.080%), Immigrants from Guatemala (3.4%, a difference of 0.16%), Hawaiian (3.4%, a difference of 0.16%), Immigrants from Belize (3.5%, a difference of 0.32%), and Alaska Native (3.5%, a difference of 0.39%).
| Demographics | Rating | Rank | Professional Degree |
| Immigrants | El Salvador | 0.3 /100 | #287 | Tragic 3.5% |
| Blackfeet | 0.3 /100 | #288 | Tragic 3.5% |
| Guatemalans | 0.3 /100 | #289 | Tragic 3.5% |
| Chippewa | 0.3 /100 | #290 | Tragic 3.5% |
| Alaska Natives | 0.3 /100 | #291 | Tragic 3.5% |
| Immigrants | Belize | 0.3 /100 | #292 | Tragic 3.5% |
| Immigrants | Honduras | 0.3 /100 | #293 | Tragic 3.5% |
| Paiute | 0.3 /100 | #294 | Tragic 3.4% |
| Immigrants | Guatemala | 0.2 /100 | #295 | Tragic 3.4% |
| Hawaiians | 0.2 /100 | #296 | Tragic 3.4% |
| Immigrants | Liberia | 0.2 /100 | #297 | Tragic 3.4% |
| Ottawa | 0.2 /100 | #298 | Tragic 3.4% |
| Immigrants | Yemen | 0.2 /100 | #299 | Tragic 3.4% |
| Blacks/African Americans | 0.2 /100 | #300 | Tragic 3.4% |
| Immigrants | Dominican Republic | 0.2 /100 | #301 | Tragic 3.4% |