Ugandan vs Arapaho In Labor Force | Age 35-44
COMPARE
Ugandan
Arapaho
In Labor Force | Age 35-44
In Labor Force | Age 35-44 Comparison
Ugandans
Arapaho
85.3%
IN LABOR FORCE | AGE 35-44
99.9/ 100
METRIC RATING
33rd/ 347
METRIC RANK
78.1%
IN LABOR FORCE | AGE 35-44
0.0/ 100
METRIC RATING
336th/ 347
METRIC RANK
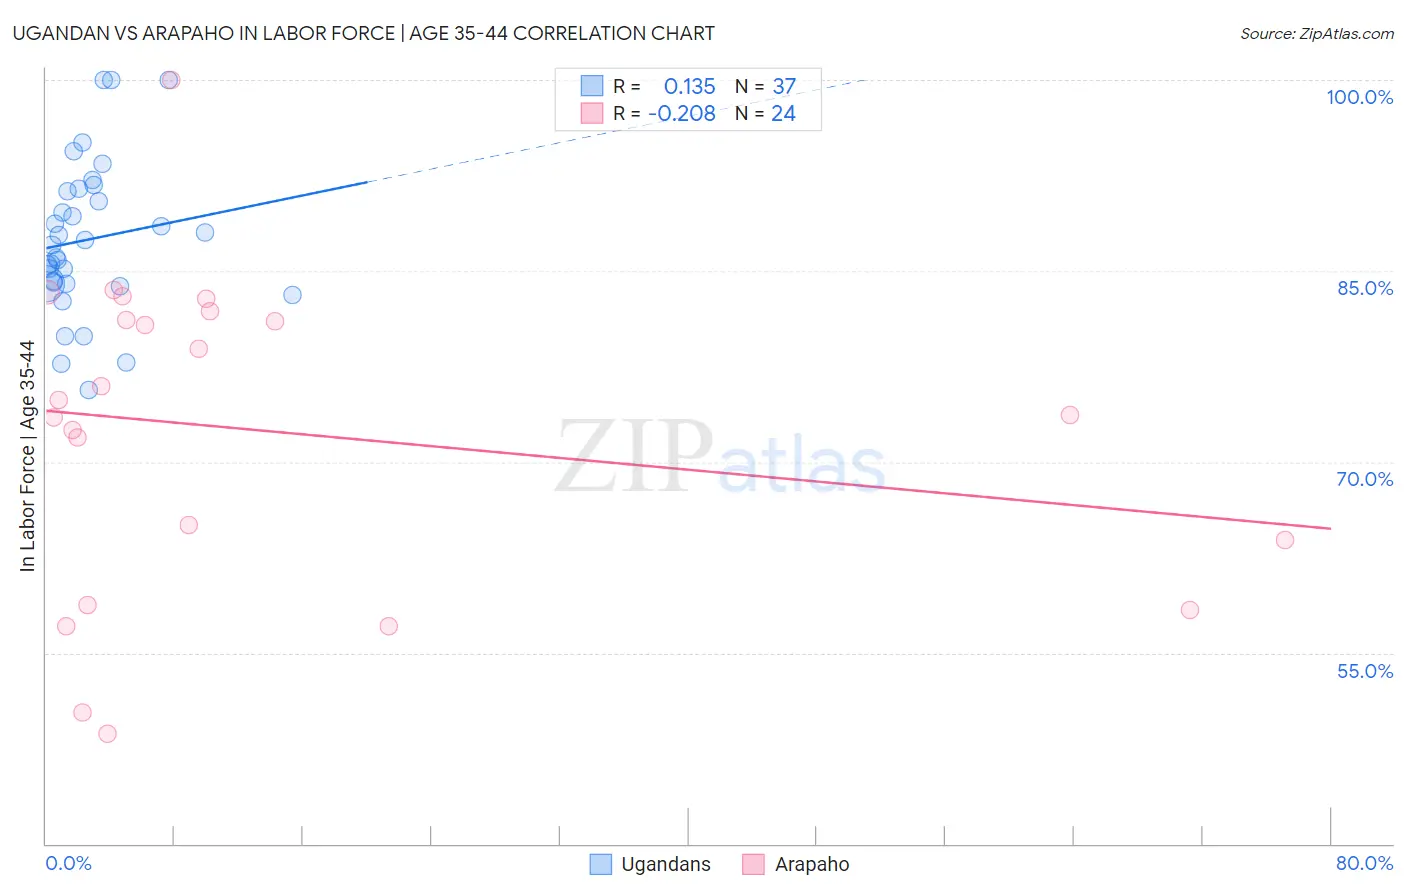
Ugandan vs Arapaho In Labor Force | Age 35-44 Correlation Chart
The statistical analysis conducted on geographies consisting of 93,996,645 people shows a poor positive correlation between the proportion of Ugandans and labor force participation rate among population between the ages 35 and 44 in the United States with a correlation coefficient (R) of 0.135 and weighted average of 85.3%. Similarly, the statistical analysis conducted on geographies consisting of 29,776,637 people shows a weak negative correlation between the proportion of Arapaho and labor force participation rate among population between the ages 35 and 44 in the United States with a correlation coefficient (R) of -0.208 and weighted average of 78.1%, a difference of 9.3%.
In Labor Force | Age 35-44 Correlation Summary
| Measurement | Ugandan | Arapaho |
| Minimum | 75.6% | 48.6% |
| Maximum | 100.0% | 100.0% |
| Range | 24.4% | 51.4% |
| Mean | 87.5% | 72.4% |
| Median | 87.1% | 74.3% |
| Interquartile 25% (IQ1) | 84.0% | 61.4% |
| Interquartile 75% (IQ3) | 91.4% | 81.5% |
| Interquartile Range (IQR) | 7.4% | 20.1% |
| Standard Deviation (Sample) | 5.9% | 12.6% |
| Standard Deviation (Population) | 5.9% | 12.3% |
Similar Demographics by In Labor Force | Age 35-44
Demographics Similar to Ugandans by In Labor Force | Age 35-44
In terms of in labor force | age 35-44, the demographic groups most similar to Ugandans are Bermudan (85.3%, a difference of 0.010%), Czech (85.3%, a difference of 0.010%), Immigrants from India (85.3%, a difference of 0.010%), Immigrants from Nepal (85.3%, a difference of 0.020%), and Cambodian (85.3%, a difference of 0.030%).
| Demographics | Rating | Rank | In Labor Force | Age 35-44 |
| Immigrants | Liberia | 99.9 /100 | #26 | Exceptional 85.4% |
| Immigrants | Lithuania | 99.9 /100 | #27 | Exceptional 85.4% |
| Immigrants | Greece | 99.9 /100 | #28 | Exceptional 85.3% |
| Cambodians | 99.9 /100 | #29 | Exceptional 85.3% |
| Bermudans | 99.9 /100 | #30 | Exceptional 85.3% |
| Czechs | 99.9 /100 | #31 | Exceptional 85.3% |
| Immigrants | India | 99.9 /100 | #32 | Exceptional 85.3% |
| Ugandans | 99.9 /100 | #33 | Exceptional 85.3% |
| Immigrants | Nepal | 99.9 /100 | #34 | Exceptional 85.3% |
| Estonians | 99.9 /100 | #35 | Exceptional 85.3% |
| Immigrants | Morocco | 99.8 /100 | #36 | Exceptional 85.2% |
| Kenyans | 99.8 /100 | #37 | Exceptional 85.2% |
| Immigrants | Poland | 99.8 /100 | #38 | Exceptional 85.2% |
| Eastern Europeans | 99.8 /100 | #39 | Exceptional 85.2% |
| Immigrants | Bulgaria | 99.8 /100 | #40 | Exceptional 85.2% |
Demographics Similar to Arapaho by In Labor Force | Age 35-44
In terms of in labor force | age 35-44, the demographic groups most similar to Arapaho are Apache (77.9%, a difference of 0.21%), Pueblo (77.4%, a difference of 0.91%), Yup'ik (77.3%, a difference of 1.0%), Native/Alaskan (78.9%, a difference of 1.0%), and Yakama (79.0%, a difference of 1.1%).
| Demographics | Rating | Rank | In Labor Force | Age 35-44 |
| Menominee | 0.0 /100 | #329 | Tragic 79.7% |
| Cheyenne | 0.0 /100 | #330 | Tragic 79.5% |
| Houma | 0.0 /100 | #331 | Tragic 79.5% |
| Ute | 0.0 /100 | #332 | Tragic 79.4% |
| Kiowa | 0.0 /100 | #333 | Tragic 79.2% |
| Yakama | 0.0 /100 | #334 | Tragic 79.0% |
| Natives/Alaskans | 0.0 /100 | #335 | Tragic 78.9% |
| Arapaho | 0.0 /100 | #336 | Tragic 78.1% |
| Apache | 0.0 /100 | #337 | Tragic 77.9% |
| Pueblo | 0.0 /100 | #338 | Tragic 77.4% |
| Yup'ik | 0.0 /100 | #339 | Tragic 77.3% |
| Lumbee | 0.0 /100 | #340 | Tragic 77.0% |
| Hopi | 0.0 /100 | #341 | Tragic 77.0% |
| Crow | 0.0 /100 | #342 | Tragic 76.5% |
| Immigrants | Yemen | 0.0 /100 | #343 | Tragic 76.3% |