Immigrants from Western Africa vs Apache In Labor Force | Age 20-64
COMPARE
Immigrants from Western Africa
Apache
In Labor Force | Age 20-64
In Labor Force | Age 20-64 Comparison
Immigrants from Western Africa
Apache
80.0%
IN LABOR FORCE | AGE 20-64
93.1/ 100
METRIC RATING
116th/ 347
METRIC RANK
73.7%
IN LABOR FORCE | AGE 20-64
0.0/ 100
METRIC RATING
334th/ 347
METRIC RANK
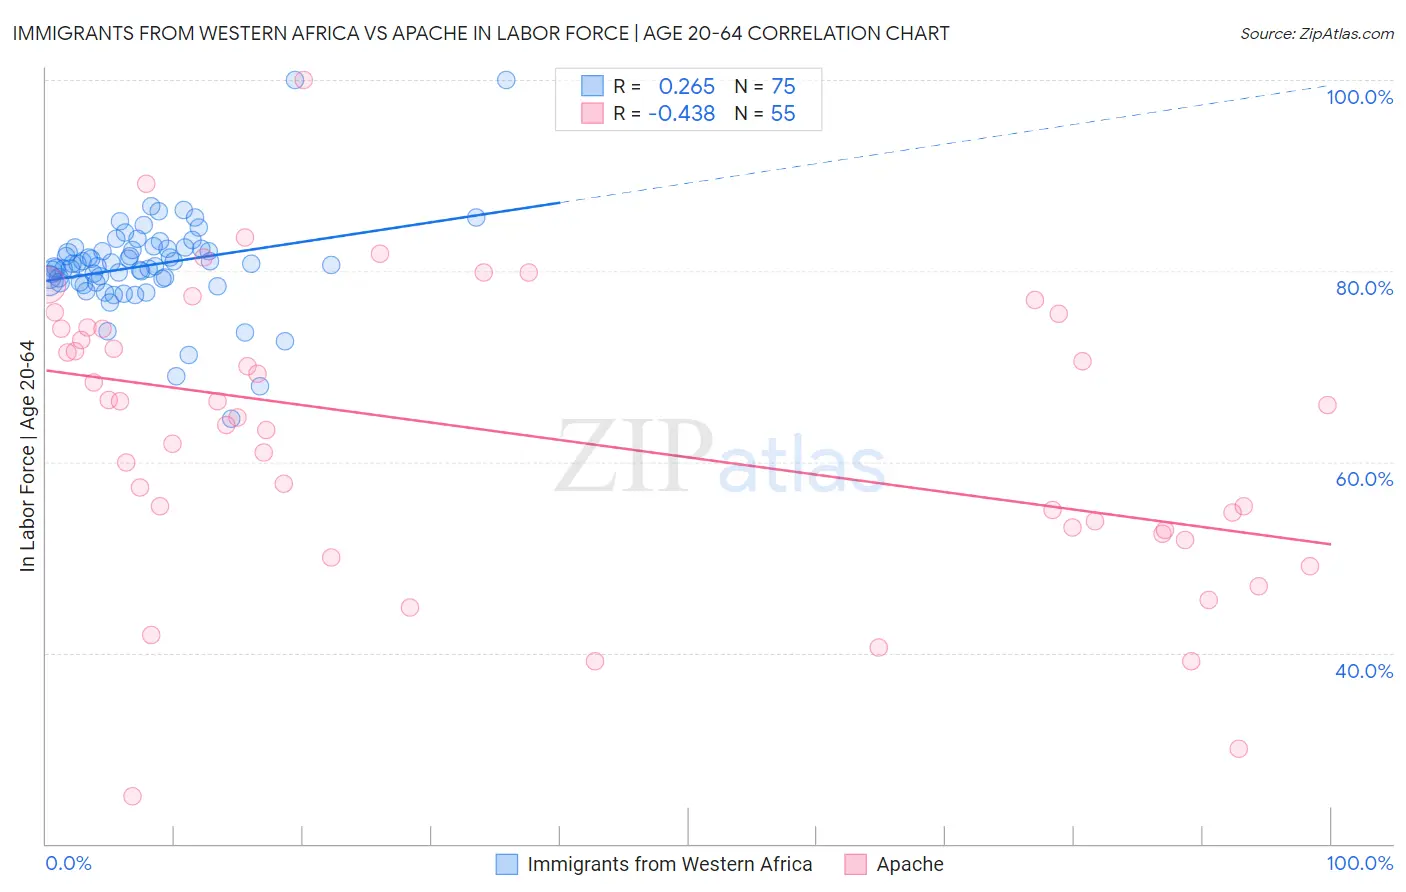
Immigrants from Western Africa vs Apache In Labor Force | Age 20-64 Correlation Chart
The statistical analysis conducted on geographies consisting of 357,882,124 people shows a weak positive correlation between the proportion of Immigrants from Western Africa and labor force participation rate among population between the ages 20 and 64 in the United States with a correlation coefficient (R) of 0.265 and weighted average of 80.0%. Similarly, the statistical analysis conducted on geographies consisting of 231,122,783 people shows a moderate negative correlation between the proportion of Apache and labor force participation rate among population between the ages 20 and 64 in the United States with a correlation coefficient (R) of -0.438 and weighted average of 73.7%, a difference of 8.6%.
In Labor Force | Age 20-64 Correlation Summary
| Measurement | Immigrants from Western Africa | Apache |
| Minimum | 64.5% | 25.0% |
| Maximum | 100.0% | 100.0% |
| Range | 35.5% | 75.0% |
| Mean | 80.6% | 62.9% |
| Median | 80.6% | 64.7% |
| Interquartile 25% (IQ1) | 78.8% | 52.8% |
| Interquartile 75% (IQ3) | 82.3% | 74.0% |
| Interquartile Range (IQR) | 3.5% | 21.2% |
| Standard Deviation (Sample) | 5.1% | 15.1% |
| Standard Deviation (Population) | 5.1% | 15.0% |
Similar Demographics by In Labor Force | Age 20-64
Demographics Similar to Immigrants from Western Africa by In Labor Force | Age 20-64
In terms of in labor force | age 20-64, the demographic groups most similar to Immigrants from Western Africa are Bermudan (80.0%, a difference of 0.010%), Immigrants from Vietnam (80.0%, a difference of 0.010%), Cape Verdean (80.0%, a difference of 0.010%), Argentinean (80.0%, a difference of 0.020%), and Immigrants from Taiwan (80.0%, a difference of 0.020%).
| Demographics | Rating | Rank | In Labor Force | Age 20-64 |
| Immigrants | Argentina | 94.1 /100 | #109 | Exceptional 80.0% |
| Estonians | 94.0 /100 | #110 | Exceptional 80.0% |
| Immigrants | South America | 93.9 /100 | #111 | Exceptional 80.0% |
| Immigrants | Italy | 93.9 /100 | #112 | Exceptional 80.0% |
| Sri Lankans | 93.9 /100 | #113 | Exceptional 80.0% |
| Argentineans | 93.8 /100 | #114 | Exceptional 80.0% |
| Bermudans | 93.3 /100 | #115 | Exceptional 80.0% |
| Immigrants | Western Africa | 93.1 /100 | #116 | Exceptional 80.0% |
| Immigrants | Vietnam | 92.7 /100 | #117 | Exceptional 80.0% |
| Cape Verdeans | 92.7 /100 | #118 | Exceptional 80.0% |
| Immigrants | Taiwan | 92.5 /100 | #119 | Exceptional 80.0% |
| Maltese | 92.4 /100 | #120 | Exceptional 80.0% |
| Immigrants | Kuwait | 92.2 /100 | #121 | Exceptional 80.0% |
| Mongolians | 92.0 /100 | #122 | Exceptional 79.9% |
| Immigrants | Russia | 91.8 /100 | #123 | Exceptional 79.9% |
Demographics Similar to Apache by In Labor Force | Age 20-64
In terms of in labor force | age 20-64, the demographic groups most similar to Apache are Ute (73.7%, a difference of 0.020%), Native/Alaskan (73.9%, a difference of 0.30%), Crow (73.3%, a difference of 0.52%), Yup'ik (73.2%, a difference of 0.64%), and Puerto Rican (73.1%, a difference of 0.85%).
| Demographics | Rating | Rank | In Labor Force | Age 20-64 |
| Sioux | 0.0 /100 | #327 | Tragic 75.0% |
| Kiowa | 0.0 /100 | #328 | Tragic 75.0% |
| Cheyenne | 0.0 /100 | #329 | Tragic 74.8% |
| Colville | 0.0 /100 | #330 | Tragic 74.8% |
| Paiute | 0.0 /100 | #331 | Tragic 74.7% |
| Arapaho | 0.0 /100 | #332 | Tragic 74.4% |
| Natives/Alaskans | 0.0 /100 | #333 | Tragic 73.9% |
| Apache | 0.0 /100 | #334 | Tragic 73.7% |
| Ute | 0.0 /100 | #335 | Tragic 73.7% |
| Crow | 0.0 /100 | #336 | Tragic 73.3% |
| Yup'ik | 0.0 /100 | #337 | Tragic 73.2% |
| Puerto Ricans | 0.0 /100 | #338 | Tragic 73.1% |
| Houma | 0.0 /100 | #339 | Tragic 72.7% |
| Pueblo | 0.0 /100 | #340 | Tragic 72.6% |
| Immigrants | Yemen | 0.0 /100 | #341 | Tragic 72.3% |