Tsimshian vs Immigrants from Uganda In Labor Force | Age 20-64
COMPARE
Tsimshian
Immigrants from Uganda
In Labor Force | Age 20-64
In Labor Force | Age 20-64 Comparison
Tsimshian
Immigrants from Uganda
78.7%
IN LABOR FORCE | AGE 20-64
0.4/ 100
METRIC RATING
259th/ 347
METRIC RANK
80.7%
IN LABOR FORCE | AGE 20-64
99.9/ 100
METRIC RATING
28th/ 347
METRIC RANK
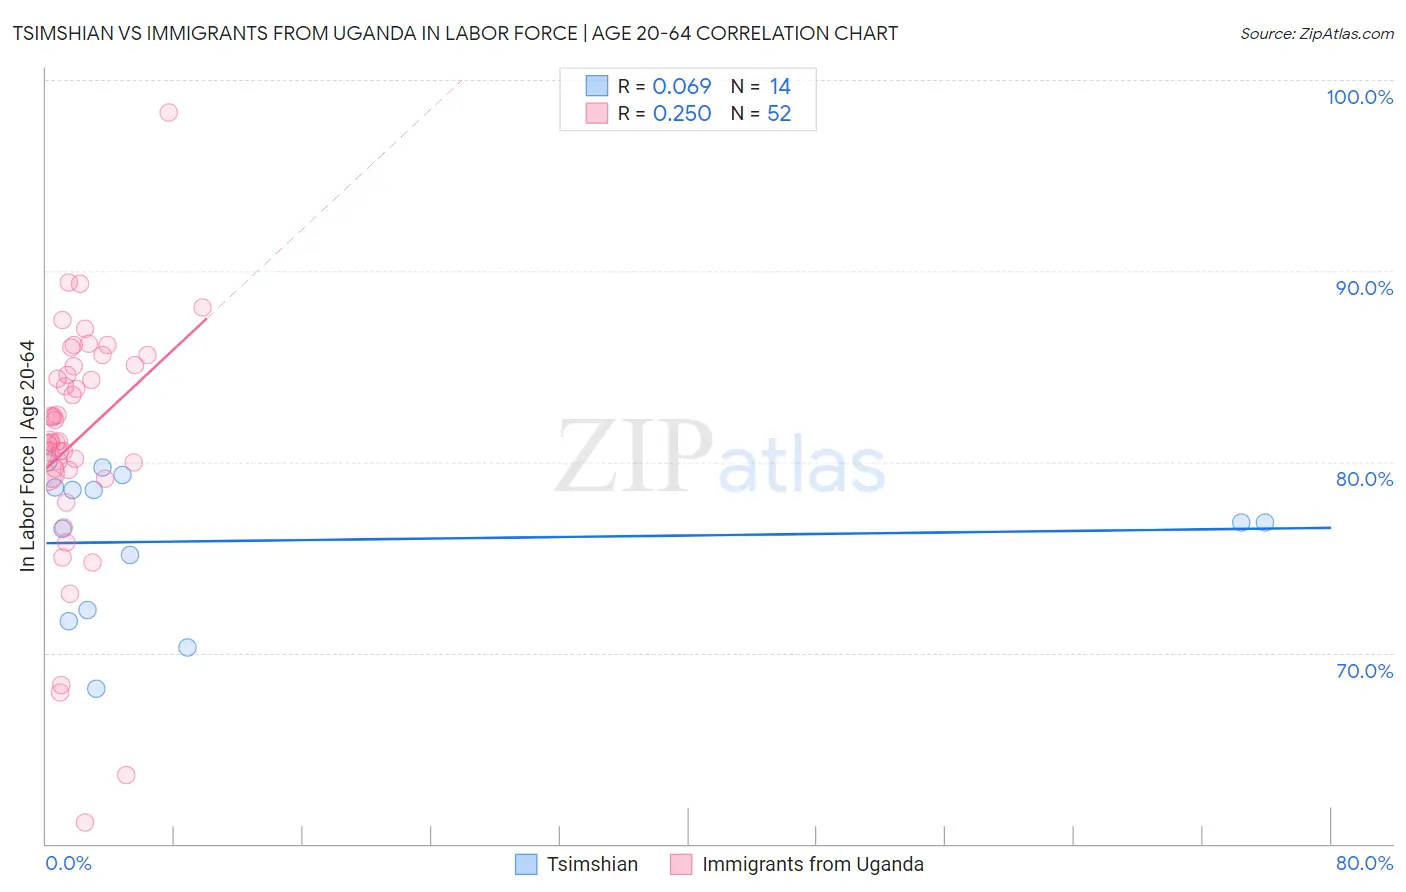
Tsimshian vs Immigrants from Uganda In Labor Force | Age 20-64 Correlation Chart
The statistical analysis conducted on geographies consisting of 15,626,183 people shows a slight positive correlation between the proportion of Tsimshian and labor force participation rate among population between the ages 20 and 64 in the United States with a correlation coefficient (R) of 0.069 and weighted average of 78.7%. Similarly, the statistical analysis conducted on geographies consisting of 125,981,186 people shows a weak positive correlation between the proportion of Immigrants from Uganda and labor force participation rate among population between the ages 20 and 64 in the United States with a correlation coefficient (R) of 0.250 and weighted average of 80.7%, a difference of 2.6%.
In Labor Force | Age 20-64 Correlation Summary
| Measurement | Tsimshian | Immigrants from Uganda |
| Minimum | 68.1% | 61.1% |
| Maximum | 80.1% | 98.3% |
| Range | 12.0% | 37.2% |
| Mean | 75.9% | 81.2% |
| Median | 76.8% | 81.1% |
| Interquartile 25% (IQ1) | 72.3% | 79.5% |
| Interquartile 75% (IQ3) | 78.7% | 85.0% |
| Interquartile Range (IQR) | 6.4% | 5.5% |
| Standard Deviation (Sample) | 3.8% | 6.3% |
| Standard Deviation (Population) | 3.7% | 6.3% |
Similar Demographics by In Labor Force | Age 20-64
Demographics Similar to Tsimshian by In Labor Force | Age 20-64
In terms of in labor force | age 20-64, the demographic groups most similar to Tsimshian are Immigrants from Guatemala (78.7%, a difference of 0.030%), Guatemalan (78.7%, a difference of 0.040%), Hawaiian (78.7%, a difference of 0.050%), Celtic (78.7%, a difference of 0.050%), and Immigrants from Lebanon (78.7%, a difference of 0.070%).
| Demographics | Rating | Rank | In Labor Force | Age 20-64 |
| Immigrants | Honduras | 0.6 /100 | #252 | Tragic 78.7% |
| Basques | 0.5 /100 | #253 | Tragic 78.7% |
| Immigrants | Lebanon | 0.5 /100 | #254 | Tragic 78.7% |
| Hawaiians | 0.5 /100 | #255 | Tragic 78.7% |
| Celtics | 0.5 /100 | #256 | Tragic 78.7% |
| Guatemalans | 0.4 /100 | #257 | Tragic 78.7% |
| Immigrants | Guatemala | 0.4 /100 | #258 | Tragic 78.7% |
| Tsimshian | 0.4 /100 | #259 | Tragic 78.7% |
| Immigrants | Fiji | 0.3 /100 | #260 | Tragic 78.6% |
| Whites/Caucasians | 0.2 /100 | #261 | Tragic 78.5% |
| Fijians | 0.1 /100 | #262 | Tragic 78.4% |
| Pennsylvania Germans | 0.1 /100 | #263 | Tragic 78.4% |
| Spaniards | 0.1 /100 | #264 | Tragic 78.4% |
| British West Indians | 0.1 /100 | #265 | Tragic 78.4% |
| Bahamians | 0.1 /100 | #266 | Tragic 78.4% |
Demographics Similar to Immigrants from Uganda by In Labor Force | Age 20-64
In terms of in labor force | age 20-64, the demographic groups most similar to Immigrants from Uganda are Immigrants from Kenya (80.7%, a difference of 0.010%), Immigrants from South Central Asia (80.7%, a difference of 0.020%), Immigrants from North Macedonia (80.7%, a difference of 0.020%), Immigrants from Lithuania (80.7%, a difference of 0.040%), and Immigrants from Ireland (80.7%, a difference of 0.050%).
| Demographics | Rating | Rank | In Labor Force | Age 20-64 |
| Liberians | 100.0 /100 | #21 | Exceptional 80.9% |
| Sudanese | 100.0 /100 | #22 | Exceptional 80.8% |
| Immigrants | Bosnia and Herzegovina | 100.0 /100 | #23 | Exceptional 80.8% |
| Immigrants | Morocco | 100.0 /100 | #24 | Exceptional 80.8% |
| Kenyans | 100.0 /100 | #25 | Exceptional 80.8% |
| Immigrants | Serbia | 100.0 /100 | #26 | Exceptional 80.8% |
| Immigrants | Kenya | 99.9 /100 | #27 | Exceptional 80.7% |
| Immigrants | Uganda | 99.9 /100 | #28 | Exceptional 80.7% |
| Immigrants | South Central Asia | 99.9 /100 | #29 | Exceptional 80.7% |
| Immigrants | North Macedonia | 99.9 /100 | #30 | Exceptional 80.7% |
| Immigrants | Lithuania | 99.9 /100 | #31 | Exceptional 80.7% |
| Immigrants | Ireland | 99.9 /100 | #32 | Exceptional 80.7% |
| Chinese | 99.9 /100 | #33 | Exceptional 80.7% |
| Immigrants | Brazil | 99.9 /100 | #34 | Exceptional 80.7% |
| Immigrants | Poland | 99.9 /100 | #35 | Exceptional 80.6% |