Tsimshian vs American In Labor Force | Age 20-64
COMPARE
Tsimshian
American
In Labor Force | Age 20-64
In Labor Force | Age 20-64 Comparison
Tsimshian
Americans
78.7%
IN LABOR FORCE | AGE 20-64
0.4/ 100
METRIC RATING
259th/ 347
METRIC RANK
77.0%
IN LABOR FORCE | AGE 20-64
0.0/ 100
METRIC RATING
309th/ 347
METRIC RANK
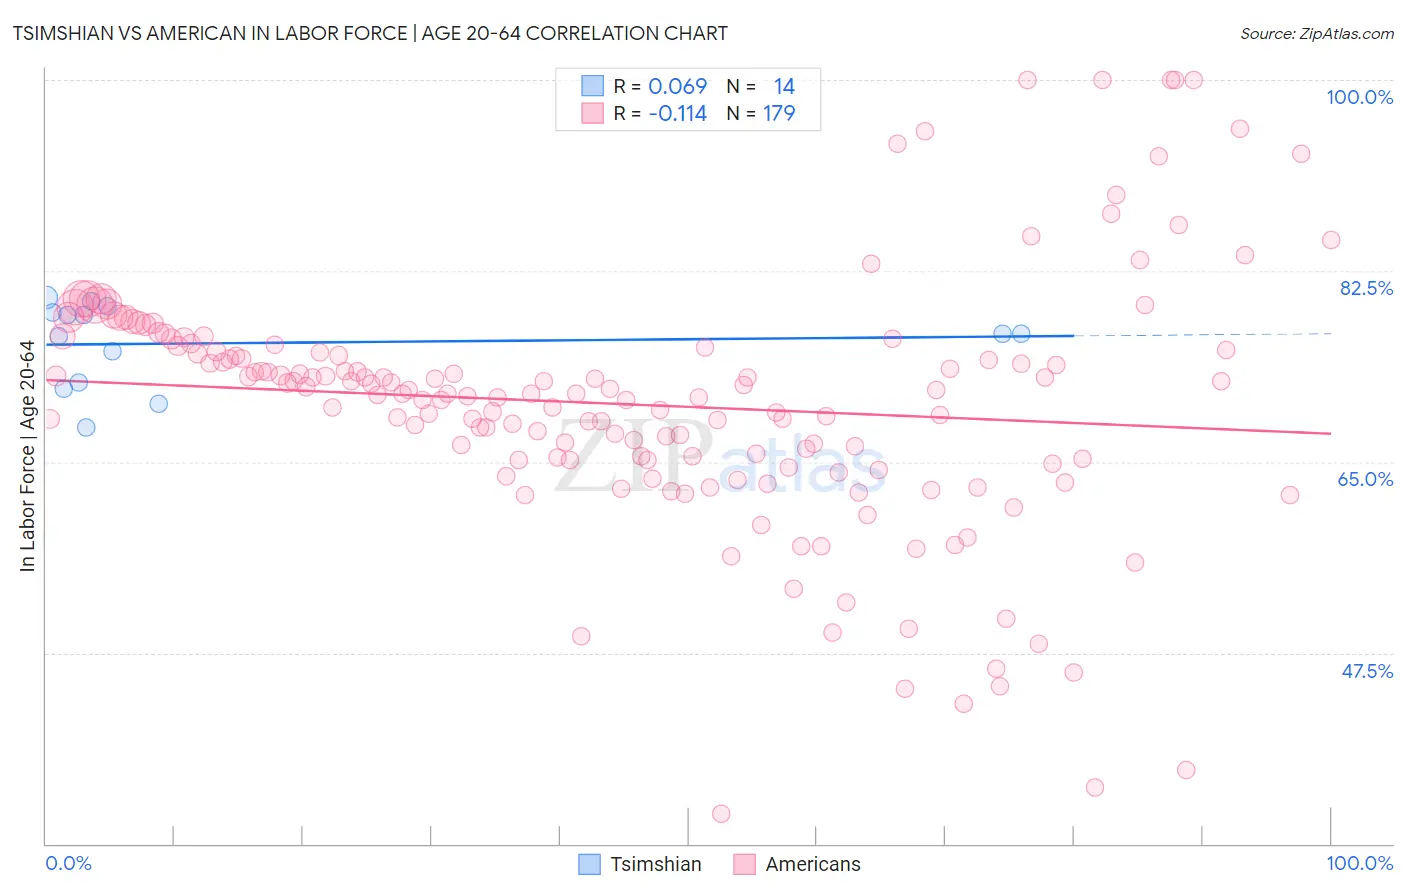
Tsimshian vs American In Labor Force | Age 20-64 Correlation Chart
The statistical analysis conducted on geographies consisting of 15,626,183 people shows a slight positive correlation between the proportion of Tsimshian and labor force participation rate among population between the ages 20 and 64 in the United States with a correlation coefficient (R) of 0.069 and weighted average of 78.7%. Similarly, the statistical analysis conducted on geographies consisting of 581,969,133 people shows a poor negative correlation between the proportion of Americans and labor force participation rate among population between the ages 20 and 64 in the United States with a correlation coefficient (R) of -0.114 and weighted average of 77.0%, a difference of 2.1%.
In Labor Force | Age 20-64 Correlation Summary
| Measurement | Tsimshian | American |
| Minimum | 68.1% | 32.8% |
| Maximum | 80.1% | 100.0% |
| Range | 12.0% | 67.2% |
| Mean | 75.9% | 70.3% |
| Median | 76.8% | 71.3% |
| Interquartile 25% (IQ1) | 72.3% | 65.2% |
| Interquartile 75% (IQ3) | 78.7% | 75.2% |
| Interquartile Range (IQR) | 6.4% | 10.0% |
| Standard Deviation (Sample) | 3.8% | 11.6% |
| Standard Deviation (Population) | 3.7% | 11.5% |
Similar Demographics by In Labor Force | Age 20-64
Demographics Similar to Tsimshian by In Labor Force | Age 20-64
In terms of in labor force | age 20-64, the demographic groups most similar to Tsimshian are Immigrants from Guatemala (78.7%, a difference of 0.030%), Guatemalan (78.7%, a difference of 0.040%), Hawaiian (78.7%, a difference of 0.050%), Celtic (78.7%, a difference of 0.050%), and Immigrants from Lebanon (78.7%, a difference of 0.070%).
| Demographics | Rating | Rank | In Labor Force | Age 20-64 |
| Immigrants | Honduras | 0.6 /100 | #252 | Tragic 78.7% |
| Basques | 0.5 /100 | #253 | Tragic 78.7% |
| Immigrants | Lebanon | 0.5 /100 | #254 | Tragic 78.7% |
| Hawaiians | 0.5 /100 | #255 | Tragic 78.7% |
| Celtics | 0.5 /100 | #256 | Tragic 78.7% |
| Guatemalans | 0.4 /100 | #257 | Tragic 78.7% |
| Immigrants | Guatemala | 0.4 /100 | #258 | Tragic 78.7% |
| Tsimshian | 0.4 /100 | #259 | Tragic 78.7% |
| Immigrants | Fiji | 0.3 /100 | #260 | Tragic 78.6% |
| Whites/Caucasians | 0.2 /100 | #261 | Tragic 78.5% |
| Fijians | 0.1 /100 | #262 | Tragic 78.4% |
| Pennsylvania Germans | 0.1 /100 | #263 | Tragic 78.4% |
| Spaniards | 0.1 /100 | #264 | Tragic 78.4% |
| British West Indians | 0.1 /100 | #265 | Tragic 78.4% |
| Bahamians | 0.1 /100 | #266 | Tragic 78.4% |
Demographics Similar to Americans by In Labor Force | Age 20-64
In terms of in labor force | age 20-64, the demographic groups most similar to Americans are Alaska Native (77.0%, a difference of 0.010%), Comanche (77.0%, a difference of 0.020%), Blackfeet (77.0%, a difference of 0.050%), Central American Indian (77.1%, a difference of 0.060%), and Alaskan Athabascan (76.9%, a difference of 0.22%).
| Demographics | Rating | Rank | In Labor Force | Age 20-64 |
| Iroquois | 0.0 /100 | #302 | Tragic 77.5% |
| Chippewa | 0.0 /100 | #303 | Tragic 77.3% |
| Immigrants | Mexico | 0.0 /100 | #304 | Tragic 77.3% |
| Mexicans | 0.0 /100 | #305 | Tragic 77.2% |
| Potawatomi | 0.0 /100 | #306 | Tragic 77.2% |
| Central American Indians | 0.0 /100 | #307 | Tragic 77.1% |
| Alaska Natives | 0.0 /100 | #308 | Tragic 77.0% |
| Americans | 0.0 /100 | #309 | Tragic 77.0% |
| Comanche | 0.0 /100 | #310 | Tragic 77.0% |
| Blackfeet | 0.0 /100 | #311 | Tragic 77.0% |
| Alaskan Athabascans | 0.0 /100 | #312 | Tragic 76.9% |
| Shoshone | 0.0 /100 | #313 | Tragic 76.8% |
| Blacks/African Americans | 0.0 /100 | #314 | Tragic 76.8% |
| Ottawa | 0.0 /100 | #315 | Tragic 76.7% |
| Yaqui | 0.0 /100 | #316 | Tragic 76.5% |