Tsimshian vs French American Indian In Labor Force | Age 20-64
COMPARE
Tsimshian
French American Indian
In Labor Force | Age 20-64
In Labor Force | Age 20-64 Comparison
Tsimshian
French American Indians
78.7%
IN LABOR FORCE | AGE 20-64
0.4/ 100
METRIC RATING
259th/ 347
METRIC RANK
78.2%
IN LABOR FORCE | AGE 20-64
0.0/ 100
METRIC RATING
273rd/ 347
METRIC RANK
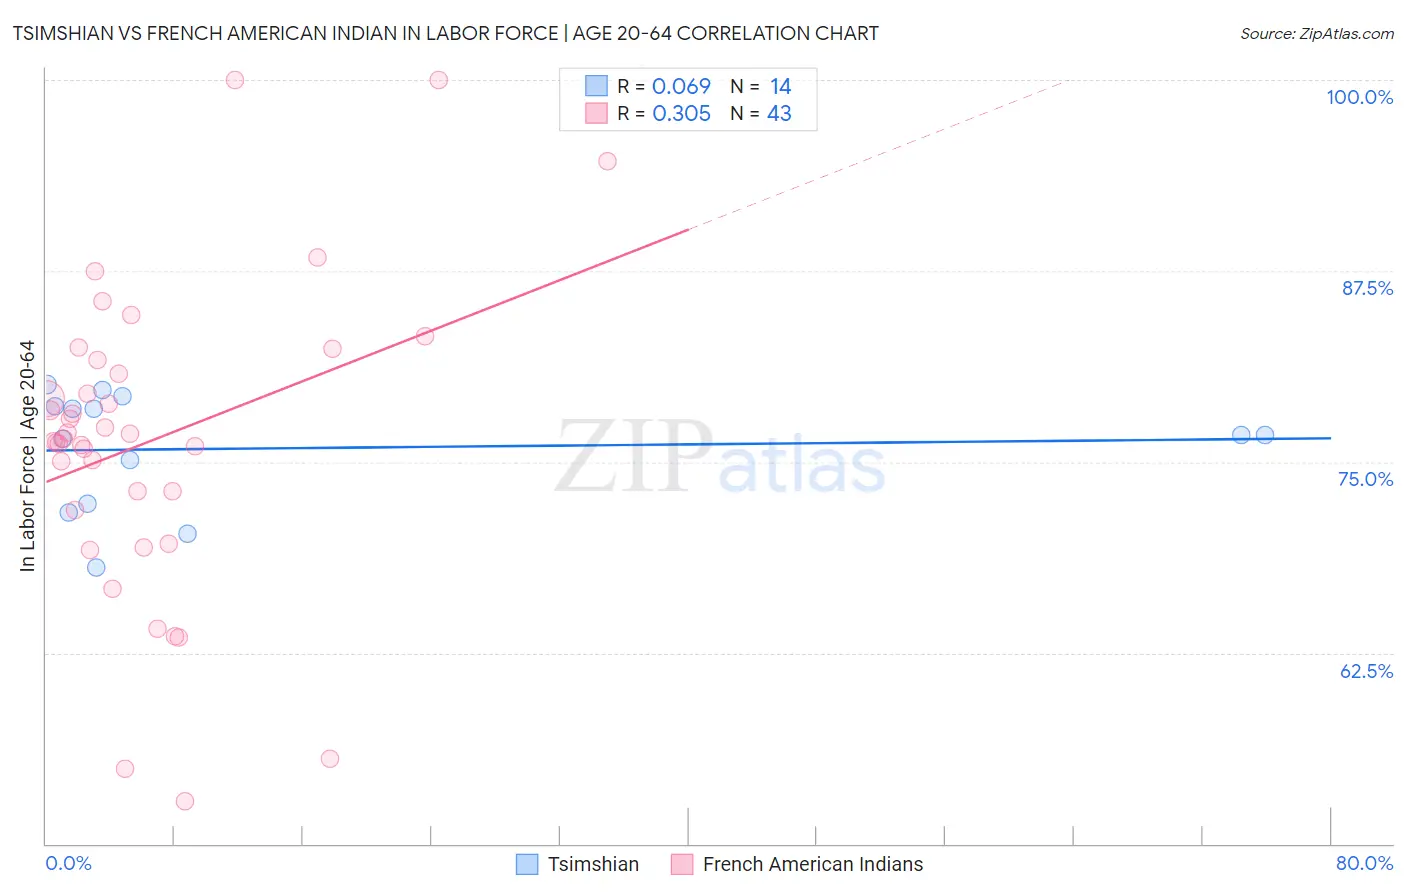
Tsimshian vs French American Indian In Labor Force | Age 20-64 Correlation Chart
The statistical analysis conducted on geographies consisting of 15,626,183 people shows a slight positive correlation between the proportion of Tsimshian and labor force participation rate among population between the ages 20 and 64 in the United States with a correlation coefficient (R) of 0.069 and weighted average of 78.7%. Similarly, the statistical analysis conducted on geographies consisting of 131,974,215 people shows a mild positive correlation between the proportion of French American Indians and labor force participation rate among population between the ages 20 and 64 in the United States with a correlation coefficient (R) of 0.305 and weighted average of 78.2%, a difference of 0.56%.
In Labor Force | Age 20-64 Correlation Summary
| Measurement | Tsimshian | French American Indian |
| Minimum | 68.1% | 52.8% |
| Maximum | 80.1% | 100.0% |
| Range | 12.0% | 47.2% |
| Mean | 75.9% | 76.4% |
| Median | 76.8% | 76.5% |
| Interquartile 25% (IQ1) | 72.3% | 71.9% |
| Interquartile 75% (IQ3) | 78.7% | 81.7% |
| Interquartile Range (IQR) | 6.4% | 9.8% |
| Standard Deviation (Sample) | 3.8% | 10.1% |
| Standard Deviation (Population) | 3.7% | 10.0% |
Demographics Similar to Tsimshian and French American Indians by In Labor Force | Age 20-64
In terms of in labor force | age 20-64, the demographic groups most similar to Tsimshian are Immigrants from Guatemala (78.7%, a difference of 0.030%), Guatemalan (78.7%, a difference of 0.040%), Celtic (78.7%, a difference of 0.050%), Immigrants from Fiji (78.6%, a difference of 0.070%), and White/Caucasian (78.5%, a difference of 0.18%). Similarly, the demographic groups most similar to French American Indians are Aleut (78.2%, a difference of 0.020%), Spanish (78.2%, a difference of 0.030%), Puget Sound Salish (78.2%, a difference of 0.030%), Marshallese (78.3%, a difference of 0.040%), and Immigrants from Latin America (78.3%, a difference of 0.050%).
| Demographics | Rating | Rank | In Labor Force | Age 20-64 |
| Celtics | 0.5 /100 | #256 | Tragic 78.7% |
| Guatemalans | 0.4 /100 | #257 | Tragic 78.7% |
| Immigrants | Guatemala | 0.4 /100 | #258 | Tragic 78.7% |
| Tsimshian | 0.4 /100 | #259 | Tragic 78.7% |
| Immigrants | Fiji | 0.3 /100 | #260 | Tragic 78.6% |
| Whites/Caucasians | 0.2 /100 | #261 | Tragic 78.5% |
| Fijians | 0.1 /100 | #262 | Tragic 78.4% |
| Pennsylvania Germans | 0.1 /100 | #263 | Tragic 78.4% |
| Spaniards | 0.1 /100 | #264 | Tragic 78.4% |
| British West Indians | 0.1 /100 | #265 | Tragic 78.4% |
| Bahamians | 0.1 /100 | #266 | Tragic 78.4% |
| U.S. Virgin Islanders | 0.1 /100 | #267 | Tragic 78.4% |
| West Indians | 0.0 /100 | #268 | Tragic 78.3% |
| Immigrants | Barbados | 0.0 /100 | #269 | Tragic 78.3% |
| Scotch-Irish | 0.0 /100 | #270 | Tragic 78.3% |
| Immigrants | Latin America | 0.0 /100 | #271 | Tragic 78.3% |
| Marshallese | 0.0 /100 | #272 | Tragic 78.3% |
| French American Indians | 0.0 /100 | #273 | Tragic 78.2% |
| Aleuts | 0.0 /100 | #274 | Tragic 78.2% |
| Spanish | 0.0 /100 | #275 | Tragic 78.2% |
| Puget Sound Salish | 0.0 /100 | #276 | Tragic 78.2% |