Immigrants from Dominica vs American In Labor Force | Age 20-64
COMPARE
Immigrants from Dominica
American
In Labor Force | Age 20-64
In Labor Force | Age 20-64 Comparison
Immigrants from Dominica
Americans
78.1%
IN LABOR FORCE | AGE 20-64
0.0/ 100
METRIC RATING
280th/ 347
METRIC RANK
77.0%
IN LABOR FORCE | AGE 20-64
0.0/ 100
METRIC RATING
309th/ 347
METRIC RANK
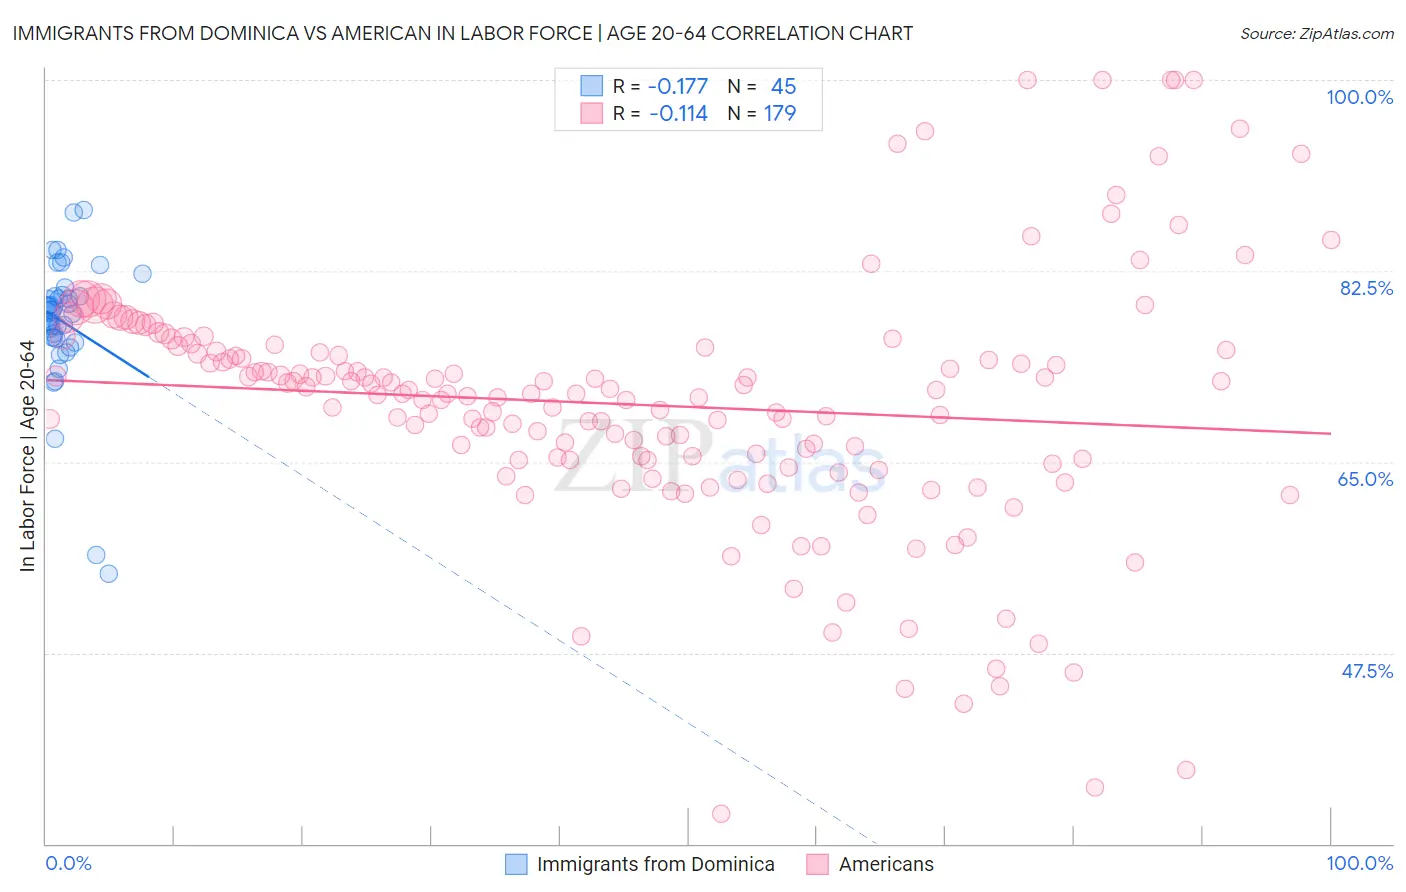
Immigrants from Dominica vs American In Labor Force | Age 20-64 Correlation Chart
The statistical analysis conducted on geographies consisting of 83,787,194 people shows a poor negative correlation between the proportion of Immigrants from Dominica and labor force participation rate among population between the ages 20 and 64 in the United States with a correlation coefficient (R) of -0.177 and weighted average of 78.1%. Similarly, the statistical analysis conducted on geographies consisting of 581,969,133 people shows a poor negative correlation between the proportion of Americans and labor force participation rate among population between the ages 20 and 64 in the United States with a correlation coefficient (R) of -0.114 and weighted average of 77.0%, a difference of 1.4%.
In Labor Force | Age 20-64 Correlation Summary
| Measurement | Immigrants from Dominica | American |
| Minimum | 54.8% | 32.8% |
| Maximum | 88.1% | 100.0% |
| Range | 33.3% | 67.2% |
| Mean | 77.8% | 70.3% |
| Median | 78.9% | 71.3% |
| Interquartile 25% (IQ1) | 76.4% | 65.2% |
| Interquartile 75% (IQ3) | 80.3% | 75.2% |
| Interquartile Range (IQR) | 3.9% | 10.0% |
| Standard Deviation (Sample) | 6.2% | 11.6% |
| Standard Deviation (Population) | 6.1% | 11.5% |
Similar Demographics by In Labor Force | Age 20-64
Demographics Similar to Immigrants from Dominica by In Labor Force | Age 20-64
In terms of in labor force | age 20-64, the demographic groups most similar to Immigrants from Dominica are Guyanese (78.1%, a difference of 0.030%), Belizean (78.2%, a difference of 0.040%), Immigrants from St. Vincent and the Grenadines (78.1%, a difference of 0.050%), Nonimmigrants (78.1%, a difference of 0.060%), and Immigrants from Guyana (78.1%, a difference of 0.080%).
| Demographics | Rating | Rank | In Labor Force | Age 20-64 |
| French American Indians | 0.0 /100 | #273 | Tragic 78.2% |
| Aleuts | 0.0 /100 | #274 | Tragic 78.2% |
| Spanish | 0.0 /100 | #275 | Tragic 78.2% |
| Puget Sound Salish | 0.0 /100 | #276 | Tragic 78.2% |
| Immigrants | Bahamas | 0.0 /100 | #277 | Tragic 78.2% |
| Mexican American Indians | 0.0 /100 | #278 | Tragic 78.2% |
| Belizeans | 0.0 /100 | #279 | Tragic 78.2% |
| Immigrants | Dominica | 0.0 /100 | #280 | Tragic 78.1% |
| Guyanese | 0.0 /100 | #281 | Tragic 78.1% |
| Immigrants | St. Vincent and the Grenadines | 0.0 /100 | #282 | Tragic 78.1% |
| Immigrants | Nonimmigrants | 0.0 /100 | #283 | Tragic 78.1% |
| Immigrants | Guyana | 0.0 /100 | #284 | Tragic 78.1% |
| Osage | 0.0 /100 | #285 | Tragic 78.0% |
| Immigrants | Belize | 0.0 /100 | #286 | Tragic 78.0% |
| Vietnamese | 0.0 /100 | #287 | Tragic 78.0% |
Demographics Similar to Americans by In Labor Force | Age 20-64
In terms of in labor force | age 20-64, the demographic groups most similar to Americans are Alaska Native (77.0%, a difference of 0.010%), Comanche (77.0%, a difference of 0.020%), Blackfeet (77.0%, a difference of 0.050%), Central American Indian (77.1%, a difference of 0.060%), and Alaskan Athabascan (76.9%, a difference of 0.22%).
| Demographics | Rating | Rank | In Labor Force | Age 20-64 |
| Iroquois | 0.0 /100 | #302 | Tragic 77.5% |
| Chippewa | 0.0 /100 | #303 | Tragic 77.3% |
| Immigrants | Mexico | 0.0 /100 | #304 | Tragic 77.3% |
| Mexicans | 0.0 /100 | #305 | Tragic 77.2% |
| Potawatomi | 0.0 /100 | #306 | Tragic 77.2% |
| Central American Indians | 0.0 /100 | #307 | Tragic 77.1% |
| Alaska Natives | 0.0 /100 | #308 | Tragic 77.0% |
| Americans | 0.0 /100 | #309 | Tragic 77.0% |
| Comanche | 0.0 /100 | #310 | Tragic 77.0% |
| Blackfeet | 0.0 /100 | #311 | Tragic 77.0% |
| Alaskan Athabascans | 0.0 /100 | #312 | Tragic 76.9% |
| Shoshone | 0.0 /100 | #313 | Tragic 76.8% |
| Blacks/African Americans | 0.0 /100 | #314 | Tragic 76.8% |
| Ottawa | 0.0 /100 | #315 | Tragic 76.7% |
| Yaqui | 0.0 /100 | #316 | Tragic 76.5% |