Russian vs American In Labor Force | Age 20-64
COMPARE
Russian
American
In Labor Force | Age 20-64
In Labor Force | Age 20-64 Comparison
Russians
Americans
80.0%
IN LABOR FORCE | AGE 20-64
95.5/ 100
METRIC RATING
103rd/ 347
METRIC RANK
77.0%
IN LABOR FORCE | AGE 20-64
0.0/ 100
METRIC RATING
309th/ 347
METRIC RANK
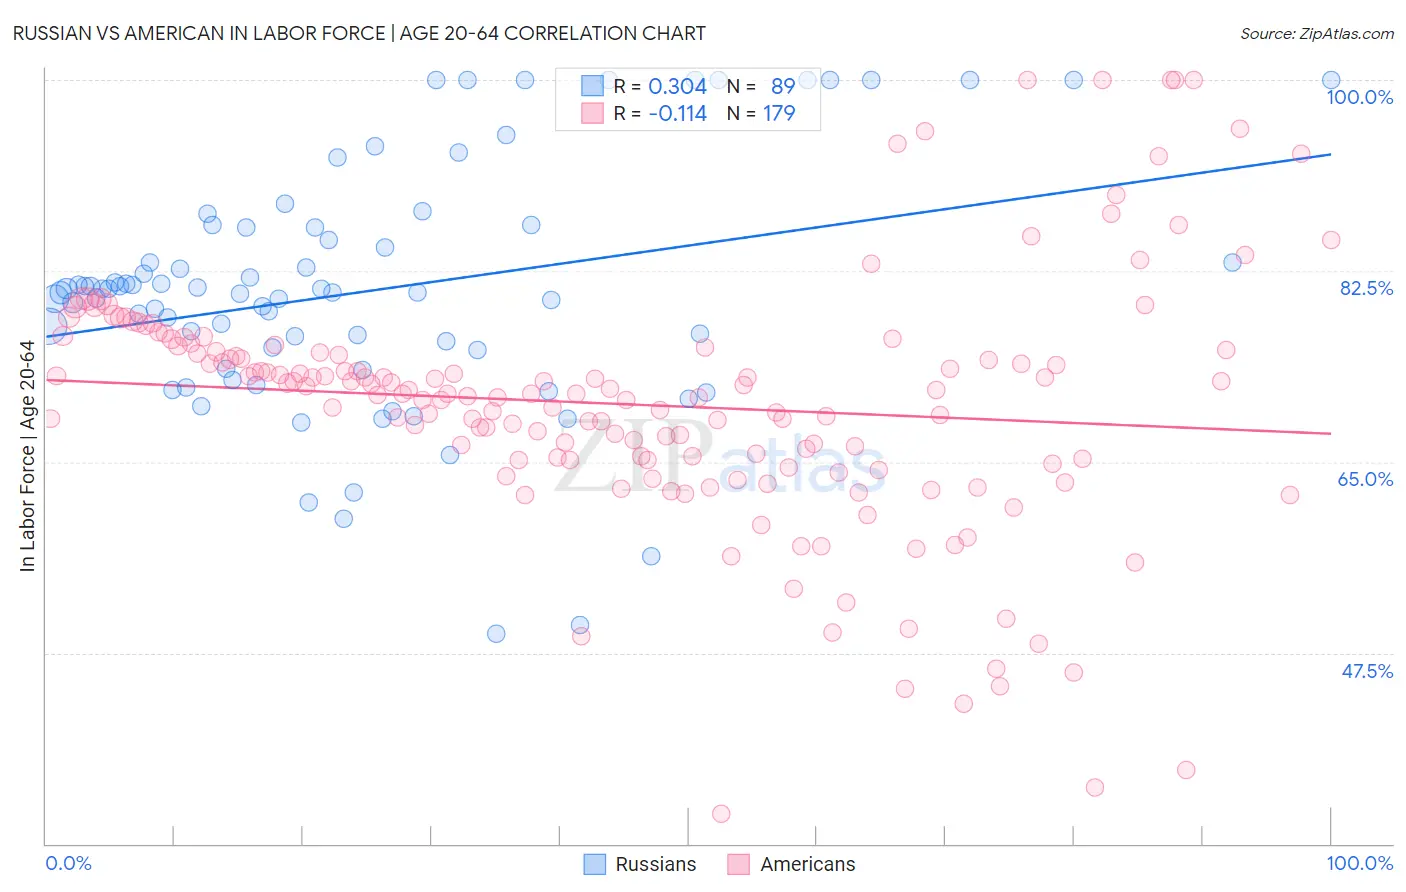
Russian vs American In Labor Force | Age 20-64 Correlation Chart
The statistical analysis conducted on geographies consisting of 512,263,785 people shows a mild positive correlation between the proportion of Russians and labor force participation rate among population between the ages 20 and 64 in the United States with a correlation coefficient (R) of 0.304 and weighted average of 80.0%. Similarly, the statistical analysis conducted on geographies consisting of 581,969,133 people shows a poor negative correlation between the proportion of Americans and labor force participation rate among population between the ages 20 and 64 in the United States with a correlation coefficient (R) of -0.114 and weighted average of 77.0%, a difference of 3.9%.
In Labor Force | Age 20-64 Correlation Summary
| Measurement | Russian | American |
| Minimum | 49.3% | 32.8% |
| Maximum | 100.0% | 100.0% |
| Range | 50.7% | 67.2% |
| Mean | 80.7% | 70.3% |
| Median | 80.5% | 71.3% |
| Interquartile 25% (IQ1) | 74.4% | 65.2% |
| Interquartile 75% (IQ3) | 86.5% | 75.2% |
| Interquartile Range (IQR) | 12.0% | 10.0% |
| Standard Deviation (Sample) | 11.2% | 11.6% |
| Standard Deviation (Population) | 11.2% | 11.5% |
Similar Demographics by In Labor Force | Age 20-64
Demographics Similar to Russians by In Labor Force | Age 20-64
In terms of in labor force | age 20-64, the demographic groups most similar to Russians are Palestinian (80.0%, a difference of 0.0%), Immigrants from Australia (80.0%, a difference of 0.0%), Immigrants from Chile (80.1%, a difference of 0.010%), Filipino (80.1%, a difference of 0.010%), and Venezuelan (80.0%, a difference of 0.010%).
| Demographics | Rating | Rank | In Labor Force | Age 20-64 |
| Immigrants | Malaysia | 95.9 /100 | #96 | Exceptional 80.1% |
| South Americans | 95.9 /100 | #97 | Exceptional 80.1% |
| Immigrants | Uruguay | 95.8 /100 | #98 | Exceptional 80.1% |
| Immigrants | Chile | 95.7 /100 | #99 | Exceptional 80.1% |
| Filipinos | 95.6 /100 | #100 | Exceptional 80.1% |
| Palestinians | 95.5 /100 | #101 | Exceptional 80.0% |
| Immigrants | Australia | 95.5 /100 | #102 | Exceptional 80.0% |
| Russians | 95.5 /100 | #103 | Exceptional 80.0% |
| Venezuelans | 95.3 /100 | #104 | Exceptional 80.0% |
| Immigrants | Ghana | 95.0 /100 | #105 | Exceptional 80.0% |
| Greeks | 94.8 /100 | #106 | Exceptional 80.0% |
| Immigrants | Jordan | 94.8 /100 | #107 | Exceptional 80.0% |
| Iranians | 94.3 /100 | #108 | Exceptional 80.0% |
| Immigrants | Argentina | 94.1 /100 | #109 | Exceptional 80.0% |
| Estonians | 94.0 /100 | #110 | Exceptional 80.0% |
Demographics Similar to Americans by In Labor Force | Age 20-64
In terms of in labor force | age 20-64, the demographic groups most similar to Americans are Alaska Native (77.0%, a difference of 0.010%), Comanche (77.0%, a difference of 0.020%), Blackfeet (77.0%, a difference of 0.050%), Central American Indian (77.1%, a difference of 0.060%), and Alaskan Athabascan (76.9%, a difference of 0.22%).
| Demographics | Rating | Rank | In Labor Force | Age 20-64 |
| Iroquois | 0.0 /100 | #302 | Tragic 77.5% |
| Chippewa | 0.0 /100 | #303 | Tragic 77.3% |
| Immigrants | Mexico | 0.0 /100 | #304 | Tragic 77.3% |
| Mexicans | 0.0 /100 | #305 | Tragic 77.2% |
| Potawatomi | 0.0 /100 | #306 | Tragic 77.2% |
| Central American Indians | 0.0 /100 | #307 | Tragic 77.1% |
| Alaska Natives | 0.0 /100 | #308 | Tragic 77.0% |
| Americans | 0.0 /100 | #309 | Tragic 77.0% |
| Comanche | 0.0 /100 | #310 | Tragic 77.0% |
| Blackfeet | 0.0 /100 | #311 | Tragic 77.0% |
| Alaskan Athabascans | 0.0 /100 | #312 | Tragic 76.9% |
| Shoshone | 0.0 /100 | #313 | Tragic 76.8% |
| Blacks/African Americans | 0.0 /100 | #314 | Tragic 76.8% |
| Ottawa | 0.0 /100 | #315 | Tragic 76.7% |
| Yaqui | 0.0 /100 | #316 | Tragic 76.5% |