Samoan vs American In Labor Force | Age 20-64
COMPARE
Samoan
American
In Labor Force | Age 20-64
In Labor Force | Age 20-64 Comparison
Samoans
Americans
79.0%
IN LABOR FORCE | AGE 20-64
2.9/ 100
METRIC RATING
236th/ 347
METRIC RANK
77.0%
IN LABOR FORCE | AGE 20-64
0.0/ 100
METRIC RATING
309th/ 347
METRIC RANK
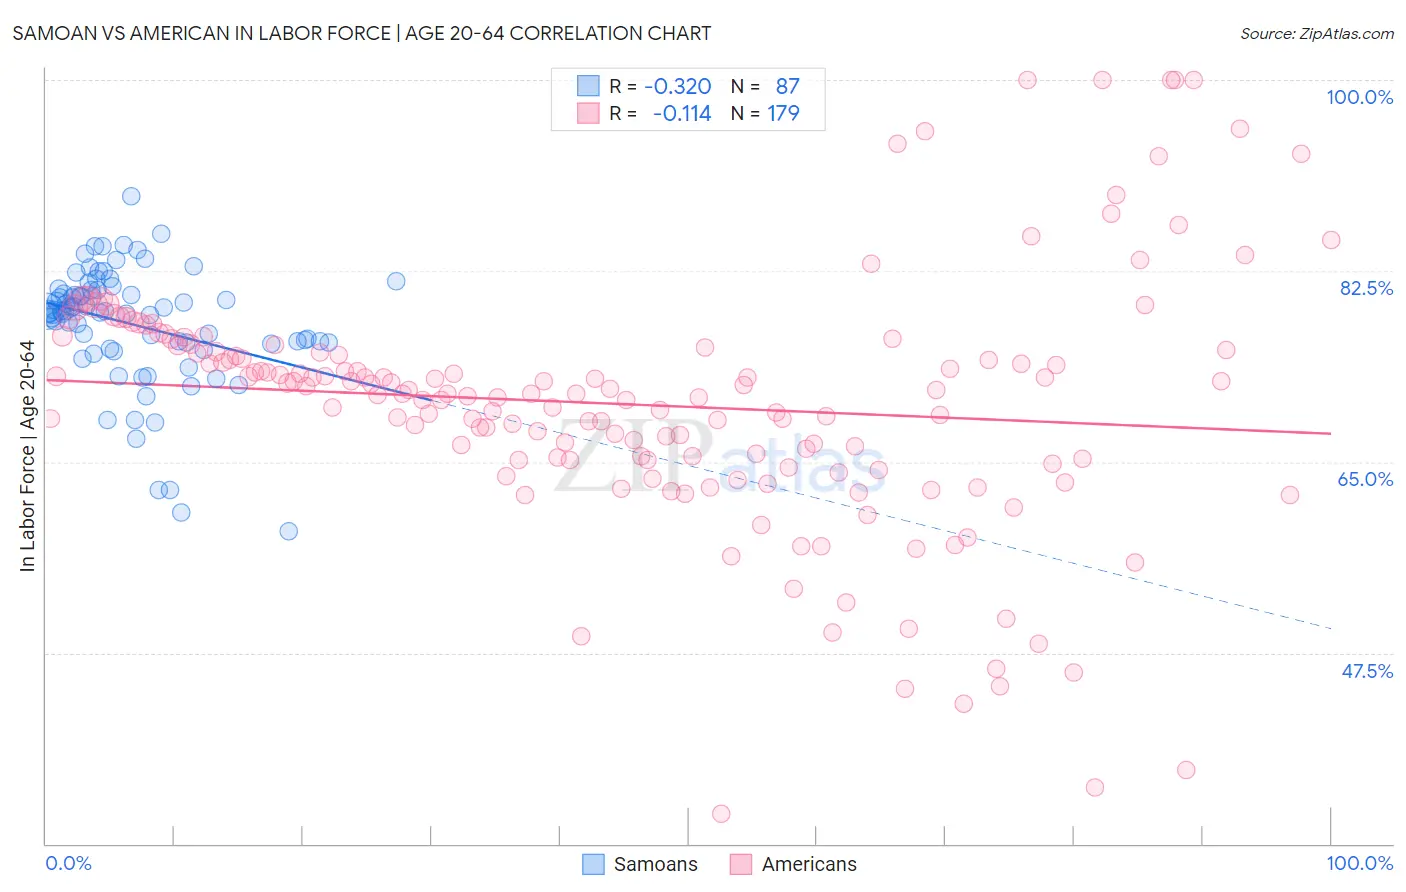
Samoan vs American In Labor Force | Age 20-64 Correlation Chart
The statistical analysis conducted on geographies consisting of 225,189,054 people shows a mild negative correlation between the proportion of Samoans and labor force participation rate among population between the ages 20 and 64 in the United States with a correlation coefficient (R) of -0.320 and weighted average of 79.0%. Similarly, the statistical analysis conducted on geographies consisting of 581,969,133 people shows a poor negative correlation between the proportion of Americans and labor force participation rate among population between the ages 20 and 64 in the United States with a correlation coefficient (R) of -0.114 and weighted average of 77.0%, a difference of 2.5%.
In Labor Force | Age 20-64 Correlation Summary
| Measurement | Samoan | American |
| Minimum | 58.6% | 32.8% |
| Maximum | 89.4% | 100.0% |
| Range | 30.8% | 67.2% |
| Mean | 77.6% | 70.3% |
| Median | 78.8% | 71.3% |
| Interquartile 25% (IQ1) | 75.9% | 65.2% |
| Interquartile 75% (IQ3) | 80.7% | 75.2% |
| Interquartile Range (IQR) | 4.9% | 10.0% |
| Standard Deviation (Sample) | 5.5% | 11.6% |
| Standard Deviation (Population) | 5.5% | 11.5% |
Similar Demographics by In Labor Force | Age 20-64
Demographics Similar to Samoans by In Labor Force | Age 20-64
In terms of in labor force | age 20-64, the demographic groups most similar to Samoans are Immigrants from North America (79.0%, a difference of 0.0%), Immigrants from Canada (79.0%, a difference of 0.020%), Tlingit-Haida (79.0%, a difference of 0.020%), Immigrants from Jamaica (79.0%, a difference of 0.030%), and Welsh (79.0%, a difference of 0.040%).
| Demographics | Rating | Rank | In Labor Force | Age 20-64 |
| Alsatians | 5.7 /100 | #229 | Tragic 79.1% |
| Native Hawaiians | 5.6 /100 | #230 | Tragic 79.1% |
| Lebanese | 5.1 /100 | #231 | Tragic 79.1% |
| Guamanians/Chamorros | 4.5 /100 | #232 | Tragic 79.1% |
| Japanese | 4.0 /100 | #233 | Tragic 79.1% |
| Immigrants | Canada | 3.2 /100 | #234 | Tragic 79.0% |
| Tlingit-Haida | 3.2 /100 | #235 | Tragic 79.0% |
| Samoans | 2.9 /100 | #236 | Tragic 79.0% |
| Immigrants | North America | 2.9 /100 | #237 | Tragic 79.0% |
| Immigrants | Jamaica | 2.6 /100 | #238 | Tragic 79.0% |
| Welsh | 2.4 /100 | #239 | Tragic 79.0% |
| Trinidadians and Tobagonians | 2.3 /100 | #240 | Tragic 79.0% |
| Jamaicans | 2.0 /100 | #241 | Tragic 78.9% |
| Immigrants | Micronesia | 1.9 /100 | #242 | Tragic 78.9% |
| Immigrants | West Indies | 1.7 /100 | #243 | Tragic 78.9% |
Demographics Similar to Americans by In Labor Force | Age 20-64
In terms of in labor force | age 20-64, the demographic groups most similar to Americans are Alaska Native (77.0%, a difference of 0.010%), Comanche (77.0%, a difference of 0.020%), Blackfeet (77.0%, a difference of 0.050%), Central American Indian (77.1%, a difference of 0.060%), and Alaskan Athabascan (76.9%, a difference of 0.22%).
| Demographics | Rating | Rank | In Labor Force | Age 20-64 |
| Iroquois | 0.0 /100 | #302 | Tragic 77.5% |
| Chippewa | 0.0 /100 | #303 | Tragic 77.3% |
| Immigrants | Mexico | 0.0 /100 | #304 | Tragic 77.3% |
| Mexicans | 0.0 /100 | #305 | Tragic 77.2% |
| Potawatomi | 0.0 /100 | #306 | Tragic 77.2% |
| Central American Indians | 0.0 /100 | #307 | Tragic 77.1% |
| Alaska Natives | 0.0 /100 | #308 | Tragic 77.0% |
| Americans | 0.0 /100 | #309 | Tragic 77.0% |
| Comanche | 0.0 /100 | #310 | Tragic 77.0% |
| Blackfeet | 0.0 /100 | #311 | Tragic 77.0% |
| Alaskan Athabascans | 0.0 /100 | #312 | Tragic 76.9% |
| Shoshone | 0.0 /100 | #313 | Tragic 76.8% |
| Blacks/African Americans | 0.0 /100 | #314 | Tragic 76.8% |
| Ottawa | 0.0 /100 | #315 | Tragic 76.7% |
| Yaqui | 0.0 /100 | #316 | Tragic 76.5% |