Tohono O'odham vs Slavic In Labor Force | Age 35-44
COMPARE
Tohono O'odham
Slavic
In Labor Force | Age 35-44
In Labor Force | Age 35-44 Comparison
Tohono O'odham
Slavs
74.1%
IN LABOR FORCE | AGE 35-44
0.0/ 100
METRIC RATING
346th/ 347
METRIC RANK
84.7%
IN LABOR FORCE | AGE 35-44
90.8/ 100
METRIC RATING
124th/ 347
METRIC RANK
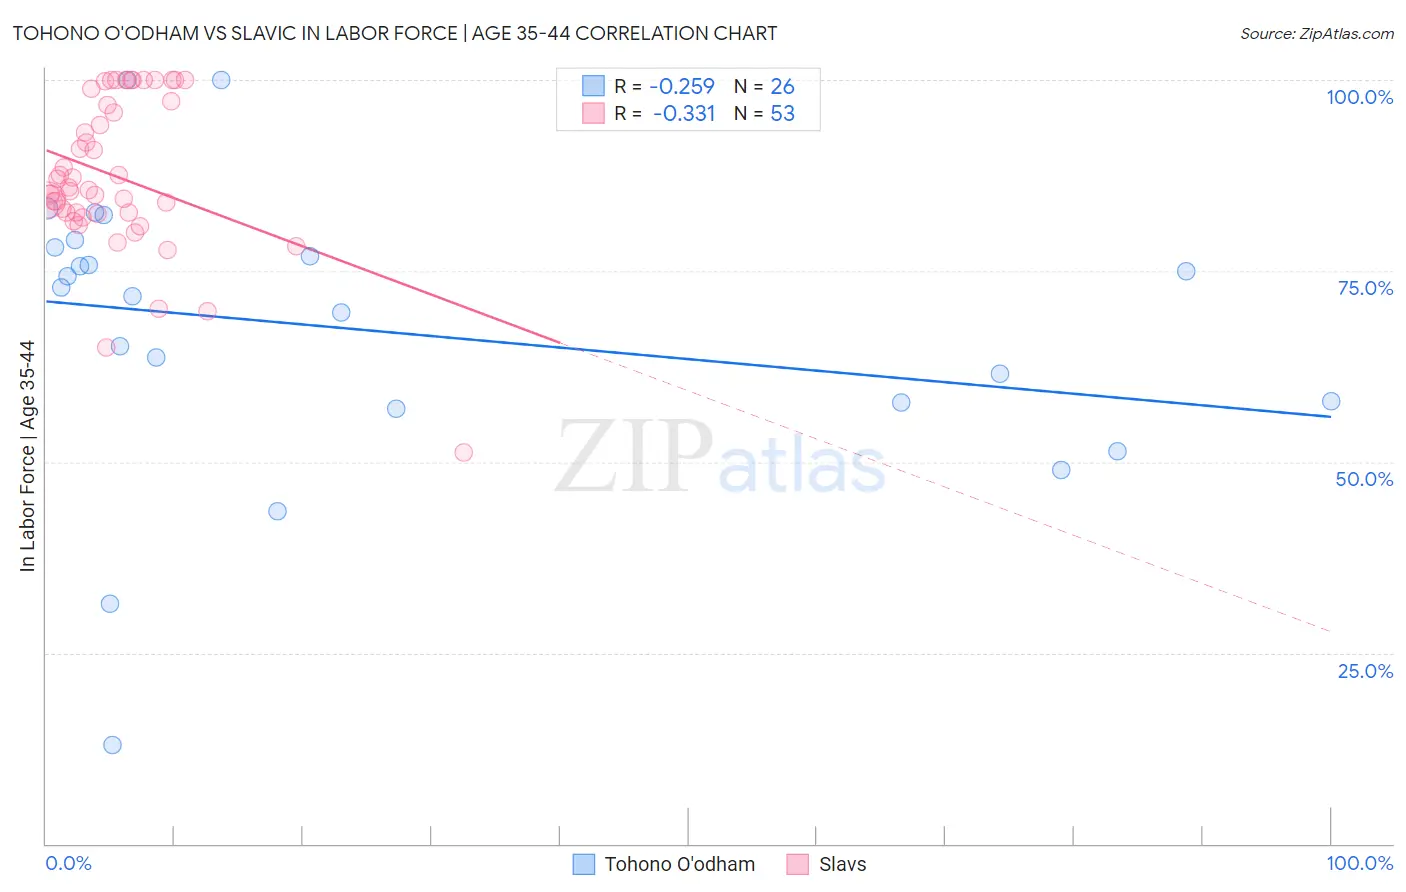
Tohono O'odham vs Slavic In Labor Force | Age 35-44 Correlation Chart
The statistical analysis conducted on geographies consisting of 58,719,465 people shows a weak negative correlation between the proportion of Tohono O'odham and labor force participation rate among population between the ages 35 and 44 in the United States with a correlation coefficient (R) of -0.259 and weighted average of 74.1%. Similarly, the statistical analysis conducted on geographies consisting of 270,832,324 people shows a mild negative correlation between the proportion of Slavs and labor force participation rate among population between the ages 35 and 44 in the United States with a correlation coefficient (R) of -0.331 and weighted average of 84.7%, a difference of 14.2%.
In Labor Force | Age 35-44 Correlation Summary
| Measurement | Tohono O'odham | Slavic |
| Minimum | 13.0% | 51.2% |
| Maximum | 100.0% | 100.0% |
| Range | 87.0% | 48.8% |
| Mean | 67.2% | 87.4% |
| Median | 72.2% | 85.5% |
| Interquartile 25% (IQ1) | 57.8% | 82.5% |
| Interquartile 75% (IQ3) | 78.1% | 96.9% |
| Interquartile Range (IQR) | 20.3% | 14.4% |
| Standard Deviation (Sample) | 19.2% | 10.1% |
| Standard Deviation (Population) | 18.8% | 10.0% |
Similar Demographics by In Labor Force | Age 35-44
Demographics Similar to Tohono O'odham by In Labor Force | Age 35-44
In terms of in labor force | age 35-44, the demographic groups most similar to Tohono O'odham are Navajo (73.8%, a difference of 0.38%), Yuman (74.7%, a difference of 0.83%), Pima (74.8%, a difference of 0.96%), Immigrants from Yemen (76.3%, a difference of 2.9%), and Crow (76.5%, a difference of 3.2%).
| Demographics | Rating | Rank | In Labor Force | Age 35-44 |
| Kiowa | 0.0 /100 | #333 | Tragic 79.2% |
| Yakama | 0.0 /100 | #334 | Tragic 79.0% |
| Natives/Alaskans | 0.0 /100 | #335 | Tragic 78.9% |
| Arapaho | 0.0 /100 | #336 | Tragic 78.1% |
| Apache | 0.0 /100 | #337 | Tragic 77.9% |
| Pueblo | 0.0 /100 | #338 | Tragic 77.4% |
| Yup'ik | 0.0 /100 | #339 | Tragic 77.3% |
| Lumbee | 0.0 /100 | #340 | Tragic 77.0% |
| Hopi | 0.0 /100 | #341 | Tragic 77.0% |
| Crow | 0.0 /100 | #342 | Tragic 76.5% |
| Immigrants | Yemen | 0.0 /100 | #343 | Tragic 76.3% |
| Pima | 0.0 /100 | #344 | Tragic 74.8% |
| Yuman | 0.0 /100 | #345 | Tragic 74.7% |
| Tohono O'odham | 0.0 /100 | #346 | Tragic 74.1% |
| Navajo | 0.0 /100 | #347 | Tragic 73.8% |
Demographics Similar to Slavs by In Labor Force | Age 35-44
In terms of in labor force | age 35-44, the demographic groups most similar to Slavs are German (84.7%, a difference of 0.0%), Immigrants from South America (84.7%, a difference of 0.0%), Maltese (84.7%, a difference of 0.0%), Asian (84.7%, a difference of 0.0%), and Immigrants from Spain (84.7%, a difference of 0.0%).
| Demographics | Rating | Rank | In Labor Force | Age 35-44 |
| Immigrants | China | 92.3 /100 | #117 | Exceptional 84.7% |
| Immigrants | Eastern Asia | 92.1 /100 | #118 | Exceptional 84.7% |
| Burmese | 91.8 /100 | #119 | Exceptional 84.7% |
| Immigrants | Northern Europe | 91.5 /100 | #120 | Exceptional 84.7% |
| Finns | 91.2 /100 | #121 | Exceptional 84.7% |
| Germans | 91.0 /100 | #122 | Exceptional 84.7% |
| Immigrants | South America | 90.9 /100 | #123 | Exceptional 84.7% |
| Slavs | 90.8 /100 | #124 | Exceptional 84.7% |
| Maltese | 90.8 /100 | #125 | Exceptional 84.7% |
| Asians | 90.6 /100 | #126 | Exceptional 84.7% |
| Immigrants | Spain | 90.6 /100 | #127 | Exceptional 84.7% |
| Immigrants | Ghana | 90.4 /100 | #128 | Exceptional 84.7% |
| Palestinians | 89.7 /100 | #129 | Excellent 84.7% |
| Bhutanese | 89.7 /100 | #130 | Excellent 84.7% |
| Immigrants | Scotland | 89.6 /100 | #131 | Excellent 84.7% |