Tohono O'odham vs Central American Currently Married
COMPARE
Tohono O'odham
Central American
Currently Married
Currently Married Comparison
Tohono O'odham
Central Americans
36.8%
CURRENTLY MARRIED
0.0/ 100
METRIC RATING
345th/ 347
METRIC RANK
43.3%
CURRENTLY MARRIED
0.0/ 100
METRIC RATING
278th/ 347
METRIC RANK
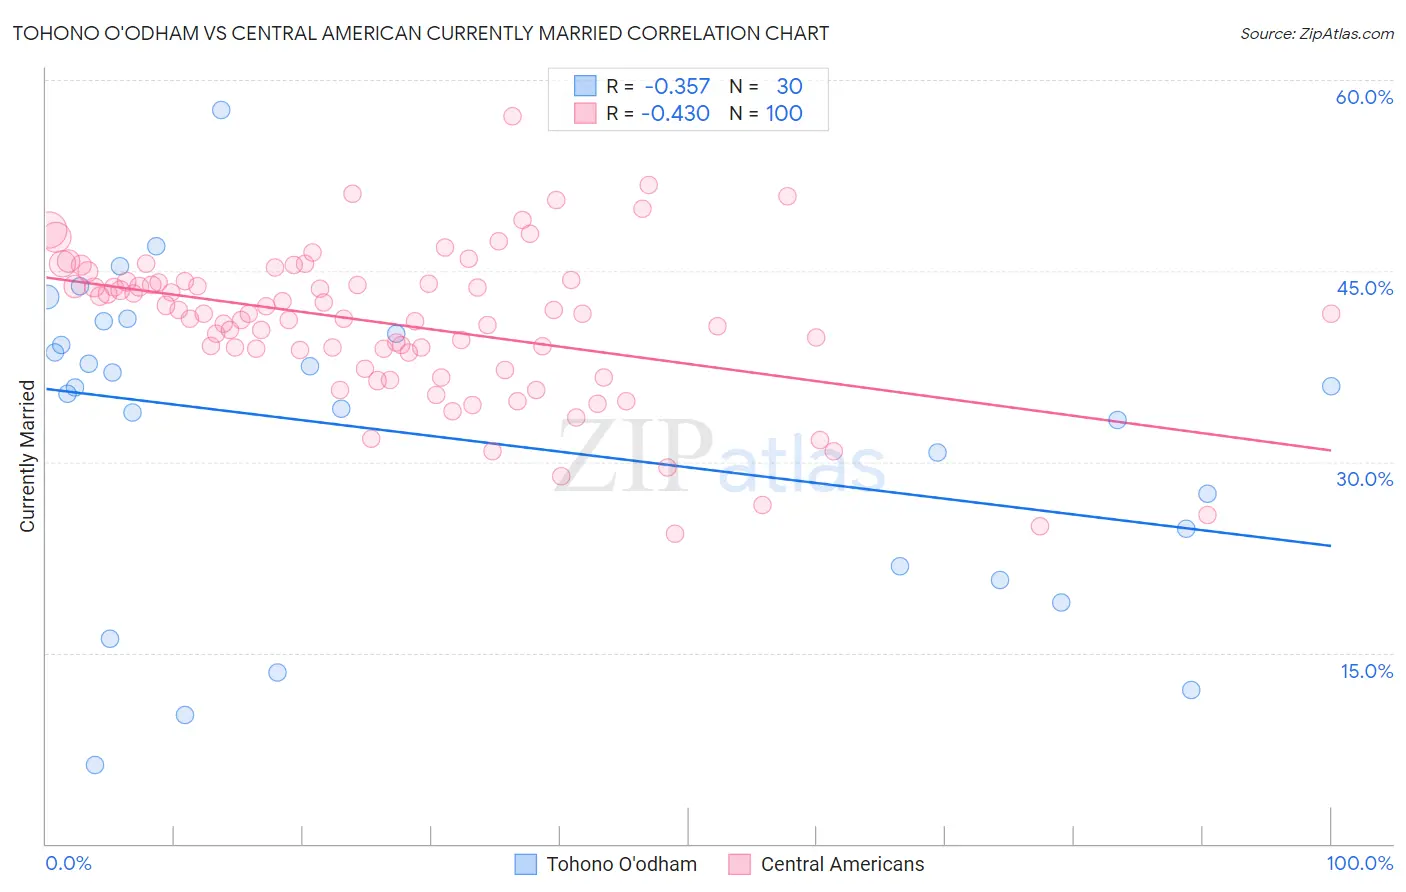
Tohono O'odham vs Central American Currently Married Correlation Chart
The statistical analysis conducted on geographies consisting of 58,730,067 people shows a mild negative correlation between the proportion of Tohono O'odham and percentage of population currently married in the United States with a correlation coefficient (R) of -0.357 and weighted average of 36.8%. Similarly, the statistical analysis conducted on geographies consisting of 504,519,011 people shows a moderate negative correlation between the proportion of Central Americans and percentage of population currently married in the United States with a correlation coefficient (R) of -0.430 and weighted average of 43.3%, a difference of 17.9%.
Currently Married Correlation Summary
| Measurement | Tohono O'odham | Central American |
| Minimum | 6.2% | 24.4% |
| Maximum | 57.6% | 57.2% |
| Range | 51.4% | 32.8% |
| Mean | 32.0% | 40.8% |
| Median | 35.6% | 41.6% |
| Interquartile 25% (IQ1) | 21.8% | 38.0% |
| Interquartile 75% (IQ3) | 40.1% | 44.1% |
| Interquartile Range (IQR) | 18.3% | 6.2% |
| Standard Deviation (Sample) | 12.3% | 6.0% |
| Standard Deviation (Population) | 12.1% | 6.0% |
Similar Demographics by Currently Married
Demographics Similar to Tohono O'odham by Currently Married
In terms of currently married, the demographic groups most similar to Tohono O'odham are Hopi (36.5%, a difference of 0.58%), Pima (35.9%, a difference of 2.4%), Immigrants from Cabo Verde (37.8%, a difference of 2.9%), Pueblo (38.2%, a difference of 4.0%), and Immigrants from Dominican Republic (38.9%, a difference of 5.9%).
| Demographics | Rating | Rank | Currently Married |
| Yup'ik | 0.0 /100 | #333 | Tragic 39.9% |
| Puerto Ricans | 0.0 /100 | #334 | Tragic 39.9% |
| Lumbee | 0.0 /100 | #335 | Tragic 39.8% |
| British West Indians | 0.0 /100 | #336 | Tragic 39.8% |
| Blacks/African Americans | 0.0 /100 | #337 | Tragic 39.6% |
| Cape Verdeans | 0.0 /100 | #338 | Tragic 39.6% |
| Dominicans | 0.0 /100 | #339 | Tragic 39.5% |
| Immigrants | Grenada | 0.0 /100 | #340 | Tragic 39.1% |
| Navajo | 0.0 /100 | #341 | Tragic 39.0% |
| Immigrants | Dominican Republic | 0.0 /100 | #342 | Tragic 38.9% |
| Pueblo | 0.0 /100 | #343 | Tragic 38.2% |
| Immigrants | Cabo Verde | 0.0 /100 | #344 | Tragic 37.8% |
| Tohono O'odham | 0.0 /100 | #345 | Tragic 36.8% |
| Hopi | 0.0 /100 | #346 | Tragic 36.5% |
| Pima | 0.0 /100 | #347 | Tragic 35.9% |
Demographics Similar to Central Americans by Currently Married
In terms of currently married, the demographic groups most similar to Central Americans are Central American Indian (43.3%, a difference of 0.15%), Immigrants from Nigeria (43.4%, a difference of 0.18%), Sierra Leonean (43.4%, a difference of 0.19%), Colville (43.4%, a difference of 0.22%), and Apache (43.2%, a difference of 0.23%).
| Demographics | Rating | Rank | Currently Married |
| Bermudans | 0.1 /100 | #271 | Tragic 43.5% |
| Indonesians | 0.1 /100 | #272 | Tragic 43.5% |
| Yaqui | 0.1 /100 | #273 | Tragic 43.4% |
| Nigerians | 0.1 /100 | #274 | Tragic 43.4% |
| Colville | 0.1 /100 | #275 | Tragic 43.4% |
| Sierra Leoneans | 0.1 /100 | #276 | Tragic 43.4% |
| Immigrants | Nigeria | 0.1 /100 | #277 | Tragic 43.4% |
| Central Americans | 0.0 /100 | #278 | Tragic 43.3% |
| Central American Indians | 0.0 /100 | #279 | Tragic 43.3% |
| Apache | 0.0 /100 | #280 | Tragic 43.2% |
| Chippewa | 0.0 /100 | #281 | Tragic 43.2% |
| Immigrants | Ecuador | 0.0 /100 | #282 | Tragic 43.2% |
| Kiowa | 0.0 /100 | #283 | Tragic 43.2% |
| Immigrants | El Salvador | 0.0 /100 | #284 | Tragic 43.1% |
| Immigrants | Middle Africa | 0.0 /100 | #285 | Tragic 43.0% |