Swiss vs Blackfeet In Labor Force | Age 16-19
COMPARE
Swiss
Blackfeet
In Labor Force | Age 16-19
In Labor Force | Age 16-19 Comparison
Swiss
Blackfeet
43.3%
IN LABOR FORCE | AGE 16-19
100.0/ 100
METRIC RATING
20th/ 347
METRIC RANK
38.9%
IN LABOR FORCE | AGE 16-19
99.4/ 100
METRIC RATING
93rd/ 347
METRIC RANK
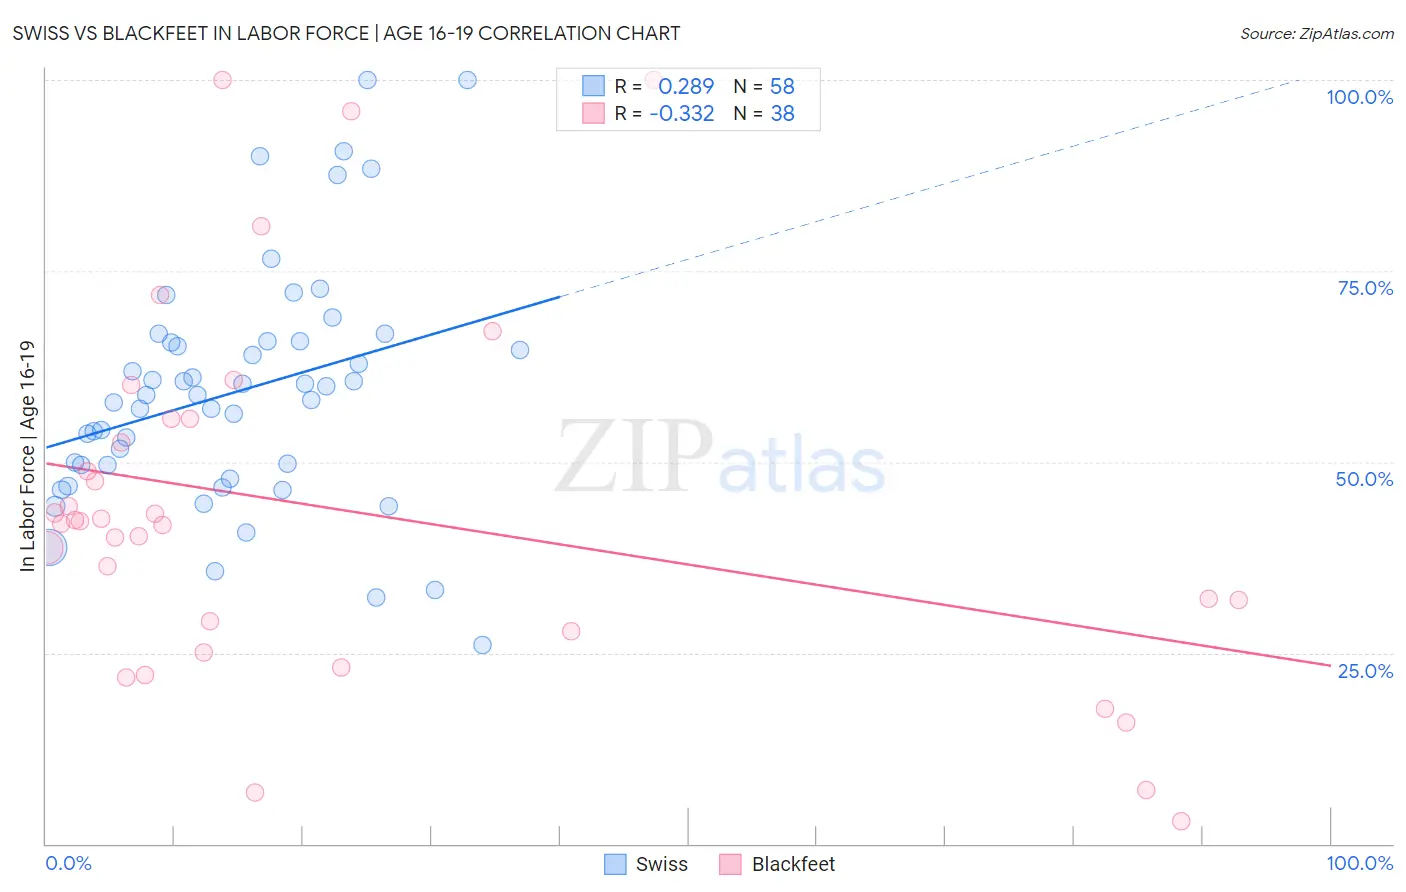
Swiss vs Blackfeet In Labor Force | Age 16-19 Correlation Chart
The statistical analysis conducted on geographies consisting of 463,664,152 people shows a weak positive correlation between the proportion of Swiss and labor force participation rate among population between the ages 16 and 19 in the United States with a correlation coefficient (R) of 0.289 and weighted average of 43.3%. Similarly, the statistical analysis conducted on geographies consisting of 309,138,575 people shows a mild negative correlation between the proportion of Blackfeet and labor force participation rate among population between the ages 16 and 19 in the United States with a correlation coefficient (R) of -0.332 and weighted average of 38.9%, a difference of 11.1%.
In Labor Force | Age 16-19 Correlation Summary
| Measurement | Swiss | Blackfeet |
| Minimum | 26.1% | 2.9% |
| Maximum | 100.0% | 100.0% |
| Range | 73.9% | 97.1% |
| Mean | 59.2% | 43.6% |
| Median | 58.8% | 42.1% |
| Interquartile 25% (IQ1) | 49.5% | 27.8% |
| Interquartile 75% (IQ3) | 65.8% | 55.7% |
| Interquartile Range (IQR) | 16.3% | 27.9% |
| Standard Deviation (Sample) | 15.7% | 23.9% |
| Standard Deviation (Population) | 15.5% | 23.6% |
Similar Demographics by In Labor Force | Age 16-19
Demographics Similar to Swiss by In Labor Force | Age 16-19
In terms of in labor force | age 16-19, the demographic groups most similar to Swiss are Belgian (43.4%, a difference of 0.22%), Ottawa (43.0%, a difference of 0.56%), French Canadian (43.6%, a difference of 0.73%), Scandinavian (43.6%, a difference of 0.80%), and Czech (43.6%, a difference of 0.87%).
| Demographics | Rating | Rank | In Labor Force | Age 16-19 |
| Dutch | 100.0 /100 | #13 | Exceptional 43.8% |
| Chippewa | 100.0 /100 | #14 | Exceptional 43.8% |
| Slovenes | 100.0 /100 | #15 | Exceptional 43.7% |
| Czechs | 100.0 /100 | #16 | Exceptional 43.6% |
| Scandinavians | 100.0 /100 | #17 | Exceptional 43.6% |
| French Canadians | 100.0 /100 | #18 | Exceptional 43.6% |
| Belgians | 100.0 /100 | #19 | Exceptional 43.4% |
| Swiss | 100.0 /100 | #20 | Exceptional 43.3% |
| Ottawa | 100.0 /100 | #21 | Exceptional 43.0% |
| Sudanese | 100.0 /100 | #22 | Exceptional 42.9% |
| Slovaks | 100.0 /100 | #23 | Exceptional 42.6% |
| Bangladeshis | 100.0 /100 | #24 | Exceptional 42.5% |
| German Russians | 100.0 /100 | #25 | Exceptional 42.4% |
| English | 100.0 /100 | #26 | Exceptional 42.4% |
| Welsh | 100.0 /100 | #27 | Exceptional 42.3% |
Demographics Similar to Blackfeet by In Labor Force | Age 16-19
In terms of in labor force | age 16-19, the demographic groups most similar to Blackfeet are Immigrants from Canada (38.9%, a difference of 0.010%), Osage (39.0%, a difference of 0.060%), Immigrants from North America (38.9%, a difference of 0.090%), Latvian (38.9%, a difference of 0.13%), and Spanish American (39.0%, a difference of 0.15%).
| Demographics | Rating | Rank | In Labor Force | Age 16-19 |
| Samoans | 99.6 /100 | #86 | Exceptional 39.1% |
| Immigrants | Germany | 99.6 /100 | #87 | Exceptional 39.1% |
| Puget Sound Salish | 99.6 /100 | #88 | Exceptional 39.1% |
| Alaska Natives | 99.6 /100 | #89 | Exceptional 39.1% |
| Immigrants | Burma/Myanmar | 99.5 /100 | #90 | Exceptional 39.0% |
| Spanish Americans | 99.5 /100 | #91 | Exceptional 39.0% |
| Osage | 99.4 /100 | #92 | Exceptional 39.0% |
| Blackfeet | 99.4 /100 | #93 | Exceptional 38.9% |
| Immigrants | Canada | 99.4 /100 | #94 | Exceptional 38.9% |
| Immigrants | North America | 99.4 /100 | #95 | Exceptional 38.9% |
| Latvians | 99.4 /100 | #96 | Exceptional 38.9% |
| Greeks | 99.3 /100 | #97 | Exceptional 38.9% |
| Ugandans | 99.3 /100 | #98 | Exceptional 38.9% |
| Immigrants | North Macedonia | 99.3 /100 | #99 | Exceptional 38.9% |
| Immigrants | Thailand | 99.1 /100 | #100 | Exceptional 38.7% |